Tuning pacemaker frequency of individual dopaminergic neurons by Kv4.3L and KChip3.1 transcription - PubMed (original) (raw)
Tuning pacemaker frequency of individual dopaminergic neurons by Kv4.3L and KChip3.1 transcription
B Liss et al. EMBO J. 2001.
Abstract
The activity of dopaminergic (DA) substantia nigra (SN) neurons is essential for voluntary movement control. An intrinsic pacemaker in DA SN neurons generates their tonic spontaneous activity, which triggers dopamine release. We show here, by combining multiplex and quantitative real-time single-cell RT- PCR with slice patch-clamp electrophysiology, that an A-type potassium channel mediated by Kv4.3 and KChip3 subunits has a key role in pacemaker control. The number of active A-type potassium channels is not only tightly associated with the pacemaker frequency of individual DA SN neurons, but is also highly correlated with their number of Kv4.3L (long splice variant) and KChip3.1 (long splice variant) mRNA molecules. Consequently, the variation of Kv4alpha and Kv4beta subunit transcript numbers is sufficient to explain the full spectrum of spontaneous pacemaker frequencies in identified DA SN neurons. This linear coupling between Kv4alpha as well as Kv4beta mRNA abundance, A-type channel density and pacemaker frequency suggests a surprisingly simple molecular mechanism for how DA SN neurons tune their variable firing rates by transcriptional control of ion channel genes.
Figures
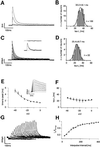
Fig. 1. Biophysical properties of native A-type potassium channels in DA SN neurons. (A) Whole-cell recording of a DA SN neuron. Membrane potential was stepped from a holding potential of –80 mV to depolarized potentials (–60 to –30 mV) in steps of 10 mV to elicit fast-inactivating potassium outward currents. (B) Frequency distribution of the dominant fast time constant of inactivation of A-type potassium currents recorded in 100 DA SN neurons at –40 mV (tau-i1) in the standard whole-cell configuration. (C) Nucleated outside-out recording of a DA SN neuron. Membrane potential was stepped from a holding potential of –80 mV to 0 mV in 10 mV intervals to elicit fast-inactivating potassium outward currents. As is evident from the fit residuals (insert) in outside-out recordings, inactivation kinetics were well described with a single exponential decay. (D) Frequency distribution of the fast time constant of inactivation of A-type potassium currents recorded in 22 DA SN neurons at –40 mV (tau-i1) in the nucleated outside-out configuration. (E) Mean activation kinetics of A-type potassium currents (insert) in nucleated outside-out recordings expressed as time-to-peak, show clear voltage dependence in contrast to their mean inactivation kinetics shown in (F) (n = 10). (G) Double-pulse experiments (–40 mV) with varying interpulse intervals at –80 mV revealed the kinetics of the recovery from inactivation of A-type potassium channels in DA SN neurons. Current responses to the second pulse after varying interpulse intervals between 25 and 400 ms recorded in nucleated outside-out patches are shown. (H) The mean recovery from inactivation in nucleated outside-out patches with an interpulse holding potential of –80 mV was well described by a single exponential function with a time constant of 172 ms (n = 6). The mean time constant of recovery calculated from fits of recovery in individual patches was 170 ± 17 ms (n = 6).
Fig. 2. Pharmacological profile of A-type potassium channels in DA SN neurons. (A) Whole-cell recording of a DA SN neuron. The membrane potential was stepped to –40 mV and current responses were recorded in increasing 4-aminopyridine (4-AP). (B) Mean dose-response for 4-AP inhibition: IC50 = 472 µM, Hill coefficient of 1 (n = 6). Mean IC50 calculated from Hill fits of individual neurons: 488 ± 131 µM (white circle, n = 6). (C) Same pulse protocol as in (A) under control and in the presence of HpTx3. (D) Mean dose-response for HpTx3 inhibition: IC50 of 81.0 ± 4.0 nM (mean ± SD of fit), Hill coefficient of 1.1 (n = 6).
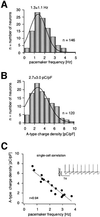
Fig. 3. Correlation of pacemaker frequencies and A-type potassium channel densities over the full physiological spectrum in DA SN neurons. (A) Frequency distribution of pacemaker frequencies from 146 DA SN neurons (standard whole-cell recordings). (B) Frequency distribution of A-type potassium charge densities (pC/pF) calculated from A-type potassium currents elicited at –40 mV from a holding potential of –80 mV recorded in 120 DA SN neurons (standard whole-cell). (C) Pacemaker frequencies and A-type potassium charge densities were codetermined in 16 DA SN neurons and show a strong linear correlation (r = 0.94, slope = –2.01, n = 16) over the full physiological range of both parameters. Insert: typical spontaneous pacemaker activity of a DA SN neuron (broken line at –40 mV).
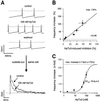
Fig. 4. A-type potassium channels control pacemaker frequencies in DA SN neurons. (A) Upper panels: current clamp whole-cell recording of pacemaker activity of a DA SN neuron under control, in the presence of 100 nM HpTx3, and after washout of the toxin (broken lines at –40 mV). After current clamp recording, an outside-out patch was pulled from the same neuron and the effect of 100 nM HpTx3 on the A-type current elicited by a voltage step to –40 mV from a holding potential of –100 mV was recorded (lower panel) to correlate the effect of a particular HpTx3 concentration on the frequency and A-type current in the same neuron. (B) Mean data from experiments in (A): the degree of HpTx3-induced frequency increase is tightly coupled to the degree of HpTx3-induced A-current inhibition determined in the same cells. The strong linear correlation (r = 0.96, slope = 1.78, n = 4–6) predicts a 2.7-fold (+170%) increase of pacemaker frequencies with complete inhibition of A-type channels. (C) Mean dose-response for HpTx3-induced frequency increase in DA SN neurons: EC50=79.8 ± 4.3 nM (mean ±SD of fit), Hill coefficient of 2.1 (n = 4–6) is virtually identical to the IC50 of HpTx3-induced A-channel inhibition (see Figure 2D).
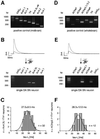
Fig. 5. Fast inactivating A-type potassium channels are mediated by Kv4.3L and KChip3.1 expression in DA SN neurons. (A) PCR positive control: all A-type potassium channel candidate subunits and the two marker transcripts are detected using mouse midbrain cDNA (<10 fmol) as a PCR template. The amplified fragments had sizes (bp) predicted by their corresponding mRNA sequences. (B) Multiplex PCR expression profiling of a single dopaminergic (TH+, GAD67–) SN neuron displaying fast-inactivating A-type potassium current evoked by membrane depolarizations to –50 and –40 mV from a holding potential of –80 mV (upper panel). Agarose gel analysis (lower panel) shows that TH and Kv4.3L were coexpressed in this neuron. This homogeneous expression pattern was found for all analyzed DA SN neurons (n = 32). (C) Frequency distribution of the dominant fast time constant of inactivation of A-type potassium currents recorded (standard whole cell) in 32 genotyped (TH+, Kv4.3L+) DA SN neurons at –40 mV. This distribution is very similar to those of non-genotyped DA SN neurons shown in Figure 1B and D. (D–F) Same type of single-cell multiplex RT–PCR experiments as shown in (A–C) for KChip1-4 expression. (D) Positive control: all probed KChip subunits were expressed in mouse brain with KChip2.4, KChip3.1 (as well as KChip3.2) and KChip4.1 being the most prominent splice variants. (E) Agarose gel analysis shows that only TH and KChip3.1 were coexpressed in this DA SN neuron. This homogeneous expression pattern was found for all analyzed DA SN neurons (n = 12). (F) Frequency distribution of the dominant fast time constant of inactivation of A-type potassium currents recorded in 12 genotyped (TH+, KChip3.1+) SN neurons at –40 mV.
Fig. 6. Double immunolabelling demonstrates Kv4.3 protein expression in DA SN neurons. Upper panels: overview of the distribution of Kv4.3 (green) and TH immunoreactivity (red) in the substantia nigra. Scale bars: 100 µm. Lower panels: Kv4.3 (green) and TH immunoreactivity (red) of a single DA SN neuron at high resolution. Scale bars: 10 µm.
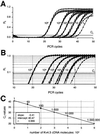
Fig. 7. Real-time fluorescent RT–PCR standard curve for single-cell Kv4.3L quantification. (A) Sensitivity and reproducibility of the real-time fluorescent RT–PCR protocol for Kv4.3L. Relative fluorescence intensities (_R_f) were plotted against PCR cycle number for quadruple experiments with five different calculated numbers of Kv4.3L dsDNA template molecules (ranging from 1 to 1 000 000 molecules, as indicated). (B) Same data as in (A) are plotted on a logarithmic _R_f scale, for better illustration of the exponential phase of the PCR. Slopes of the exponential amplification phases are highly reproducible and independent of template concentration. The bold line indicates the fluorescence threshold of amplification detection at _R_f = 0.08, manually set within the exponential PCR phase. (C) Absolute standard curve for Kv4.3L cDNA detection derived from data shown in (A) and (B). The cycle number where the relative fluorescence crosses this threshold of amplification detection is defined as the Ct value. Mean Ct values for different numbers of Kv4.3L template molecules are plotted against their respective numbers of template molecules on a logarithmic scale. The linear regression fit (r = 0.999) defined the intercept as PCR cycle 40.47.
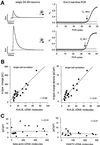
Fig. 8. Linear correlation between A-type potassium charge and density, and number of Kv4.3 cDNA molecules. (A) Two examples of single-cell real-time fluorescent RT–PCR experiments on individual DA SN neurons. Different A-type current amplitudes with similar inactivation kinetics (corresponding to differences in A-type potassium charge transfer) are elicited by membrane depolarizations to –40 mV from a holding potential of –80 mV (left panels). The bold line indicates the threshold of amplification detection at _R_f = 0.08. The DA SN neuron with a 4-fold smaller A-type potassium current displayed a Ct value of 38.2 (upper panels) that was about two cycles larger compared with that of the other DA SN neuron (Ct = 36.1). A difference of two Ct values corresponds to a 4-fold difference in Kv4.3L cDNA template concentration. (B) A-type potassium charge (left panel) and charge densities (right panel), and number of Kv4.3L cDNA molecules were codetermined in 21 DA SN neurons and show strong linear correlation (r = 0.90 and 0.91, respectively) over the full physiological range of both parameters. (C) A-type potassium charge densities and number of β-actin (left panel) and VMAT2 (right panel) cDNA molecules each were codetermined in 18 DA SN neurons and show no correlation (r = 0.14 and 0.21, respectively).
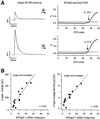
Fig. 9. Linear correlation between A-type potassium charge/density and number of KChip3 cDNA molecules. (A) Two examples of single-cell real-time fluorescent RT–PCR experiments on individual DA SN neurons (same type of experiment as described in caption to Figure 8). The DA SN neuron with an ∼4-fold smaller A-type potassium current displayed a Ct value of 39.2 (upper panels), which was about two cycles larger compared with that of the other neuron (Ct = 37.3). (B) A-type potassium charge and charge densities, and number of KChip3 cDNA molecules were codetermined in 13 DA SN neurons and show strong linear correlation (r = 0.90 and 0.92, respectively) over the full physiological range of both parameters.
Similar articles
- Converging roles of ion channels, calcium, metabolic stress, and activity pattern of Substantia nigra dopaminergic neurons in health and Parkinson's disease.
Duda J, Pötschke C, Liss B. Duda J, et al. J Neurochem. 2016 Oct;139 Suppl 1(Suppl Suppl 1):156-178. doi: 10.1111/jnc.13572. Epub 2016 Mar 23. J Neurochem. 2016. PMID: 26865375 Free PMC article. Review. - Differential expression of the small-conductance, calcium-activated potassium channel SK3 is critical for pacemaker control in dopaminergic midbrain neurons.
Wolfart J, Neuhoff H, Franz O, Roeper J. Wolfart J, et al. J Neurosci. 2001 May 15;21(10):3443-56. doi: 10.1523/JNEUROSCI.21-10-03443.2001. J Neurosci. 2001. PMID: 11331374 Free PMC article. - KChIP1 and frequenin modify shal-evoked potassium currents in pyloric neurons in the lobster stomatogastric ganglion.
Zhang Y, MacLean JN, An WF, Lanning CC, Harris-Warrick RM. Zhang Y, et al. J Neurophysiol. 2003 Apr;89(4):1902-9. doi: 10.1152/jn.00837.2002. Epub 2002 Dec 27. J Neurophysiol. 2003. PMID: 12612050 - Selective coupling of T-type calcium channels to SK potassium channels prevents intrinsic bursting in dopaminergic midbrain neurons.
Wolfart J, Roeper J. Wolfart J, et al. J Neurosci. 2002 May 1;22(9):3404-13. doi: 10.1523/JNEUROSCI.22-09-03404.2002. J Neurosci. 2002. PMID: 11978817 Free PMC article. - Dopamine midbrain neurons in health and Parkinson's disease: emerging roles of voltage-gated calcium channels and ATP-sensitive potassium channels.
Dragicevic E, Schiemann J, Liss B. Dragicevic E, et al. Neuroscience. 2015 Jan 22;284:798-814. doi: 10.1016/j.neuroscience.2014.10.037. Epub 2014 Oct 30. Neuroscience. 2015. PMID: 25450964 Review.
Cited by
- Age-dependent neuroprotective effect of an SK3 channel agonist on excitotoxity to dopaminergic neurons in organotypic culture.
Maldonado O, Jenkins A, Belalcazar HM, Hernandez-Cuervo H, Hyman KM, Ladaga G, Padilla L, de Erausquin GA. Maldonado O, et al. PLoS One. 2020 Jul 23;15(7):e0223633. doi: 10.1371/journal.pone.0223633. eCollection 2020. PLoS One. 2020. PMID: 32701951 Free PMC article. - Gene expression profiling in single cells from the pancreatic islets of Langerhans reveals lognormal distribution of mRNA levels.
Bengtsson M, Ståhlberg A, Rorsman P, Kubista M. Bengtsson M, et al. Genome Res. 2005 Oct;15(10):1388-92. doi: 10.1101/gr.3820805. Genome Res. 2005. PMID: 16204192 Free PMC article. - Profiling voltage-gated potassium channel mRNA expression in nigral neurons using single-cell RT-PCR techniques.
Ding S, Zhou FM. Ding S, et al. J Vis Exp. 2011 Sep 27;(55):3136. doi: 10.3791/3136. J Vis Exp. 2011. PMID: 21989393 Free PMC article. - Localization and targeting of voltage-dependent ion channels in mammalian central neurons.
Vacher H, Mohapatra DP, Trimmer JS. Vacher H, et al. Physiol Rev. 2008 Oct;88(4):1407-47. doi: 10.1152/physrev.00002.2008. Physiol Rev. 2008. PMID: 18923186 Free PMC article. Review. - Converging roles of ion channels, calcium, metabolic stress, and activity pattern of Substantia nigra dopaminergic neurons in health and Parkinson's disease.
Duda J, Pötschke C, Liss B. Duda J, et al. J Neurochem. 2016 Oct;139 Suppl 1(Suppl Suppl 1):156-178. doi: 10.1111/jnc.13572. Epub 2016 Mar 23. J Neurochem. 2016. PMID: 26865375 Free PMC article. Review.
References
- An W.F. et al. (2000) Modulation of A-type potassium channels by a family of calcium sensors. Nature, 403, 553–556. - PubMed
- Bahring R., Dannenberg,J., Peters,H.C., Leicher,T., Pongs,O. and Isbrandt,D. (2001) Conserved Kv4 N-terminal domain critical for effects of Kv channel-interacting protein 2.2 on channel expression and gating. J. Biol. Chem., 276, 23888–23894. - PubMed
- Baro D.J., Levini,R.M., Kim,M.T., Willms,A.R., Lanning,C.C., Rodriguez,H.E. and Harris-Warrick,R.M. (1997) Quantitative single-cell reverse transcription-PCR demonstrates that A-current magnitude varies as a linear function of shal gene expression in identified stomatogastric neurons. J. Neurosci., 17, 6597–6610. - PMC - PubMed
Publication types
MeSH terms
Substances
LinkOut - more resources
Full Text Sources
Other Literature Sources
Medical
Molecular Biology Databases
