Genomic expression responses to DNA-damaging agents and the regulatory role of the yeast ATR homolog Mec1p - PubMed (original) (raw)
Comparative Study
. 2001 Oct;12(10):2987-3003.
doi: 10.1091/mbc.12.10.2987.
Affiliations
- PMID: 11598186
- PMCID: PMC60150
- DOI: 10.1091/mbc.12.10.2987
Free PMC article
Comparative Study
Genomic expression responses to DNA-damaging agents and the regulatory role of the yeast ATR homolog Mec1p
A P Gasch et al. Mol Biol Cell. 2001 Oct.
Free PMC article
Abstract
Eukaryotic cells respond to DNA damage by arresting the cell cycle and modulating gene expression to ensure efficient DNA repair. The human ATR kinase and its homolog in yeast, MEC1, play central roles in transducing the damage signal. To characterize the role of the Mec1 pathway in modulating the cellular response to DNA damage, we used DNA microarrays to observe genomic expression in Saccharomyces cerevisiae responding to two different DNA-damaging agents. We compared the genome-wide expression patterns of wild-type cells and mutants defective in Mec1 signaling, including mec1, dun1, and crt1 mutants, under normal growth conditions and in response to the methylating-agent methylmethane sulfonate (MMS) and ionizing radiation. Here, we present a comparative analysis of wild-type and mutant cells responding to these DNA-damaging agents, and identify specific features of the gene expression responses that are dependent on the Mec1 pathway. Among the hundreds of genes whose expression was affected by Mec1p, one set of genes appears to represent an MEC1-dependent expression signature of DNA damage. Other aspects of the genomic responses were independent of Mec1p, and likely independent of DNA damage, suggesting the pleiotropic effects of MMS and ionizing radiation. The complete data set as well as supplemental materials is available at http://www-genome.stanford.edu/mec1.
Figures
Figure 1
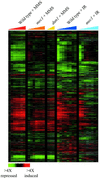
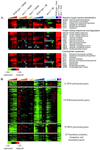
Genomic responses to MMS and ionizing radiation. The expression patterns of ∼2000 genes whose transcript levels changed more than twofold in response to either MMS or ionizing radiation (IR) are shown. Hierarchical clustering was performed as described in MATERIALS AND METHODS, analyzing genes whose transcript levels changed at least twofold from the pretreatment level on at least one microarray experiment. For clarity, the mock-irradiated time courses that were used in the clustering analysis have been omitted from this display. The results of five time courses are shown, as indicated by the legend at the top of the figure. In each time course, the columns in the figure represent samples taken at 5, 15, 30, 45, 60, 90, and 120 min after the MMS treatment in the wild-type and mec1 cells; at 30, 90, and 120 min after MMS treatment in dun1 cells; and at 5, 10, 20, 30, 45, 60, 90, and 120 min after ionizing radiation exposure in wild-type and mec1 cells. The fold changes in transcript abundance relative to the pretreament levels are represented by a color scale, as indicated by the key at the bottom of the figure.
Figure 2
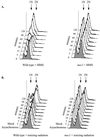
Cell-cycle progression in response to MMS and ionizing radiation. FACS analysis was performed on cells collected at each time point indicated. FACS profiles for wild-type cells (left) and mec1 cells (right) are shown after MMS treatment (A) and ionizing radiation (B). The FACS profile of the asynchronous cells used as the reference sample in each time course is shown in gray. Arrows indicate peaks in the profiles that represent cells with 1N or 2N DNA content, corresponding to cells in G1 phase or G2/M phase, respectively.
Figure 3
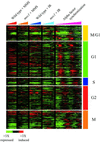
Expression of cell cycle-regulated genes. The expression of ∼700 cell cycle-regulated genes (Spellman et al., 1998) was analyzed by hierarchical clustering, as described in MATERIALS AND METHODS. The genes were divided into five classes defined by Spellman et al. (1998) (M/G1, G1, S, G2, and M), reflecting the cell-cycle phase during which those transcript levels peak in cycling cells. Each class of genes was clustered separately with the use of data recovered from a total of 86 microarrays. For this display, data are shown for wild-type and mec1 cells responding to MMS treatment and ionizing radiation (IR) (this study) and cells progressing through the cell cycle after alpha factor synchronization (Spellman et al., 1998). The time points represented for the DNA damage responses are 5, 15, 30, 45, 60, 90, and 120 min after the MMS treatment and at 5, 10, 20, 30, 45, 60, 90, and 120 min after ionizing radiation. Changes in transcript levels are represented with the use of the color scale indicated at the bottom of the figure.
Figure 4
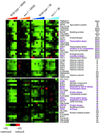
Expression of cell-cycle genes that correlated with cell-cycle arrest. Hierarchical clustering analysis of all 700 previously identified cell-cycle genes revealed three clusters of genes whose transcript levels seemed to correlate with the cell-cycle arrest point induced by MMS and ionizing radiation (IR). The time points represented for the DNA-damage responses are the same described in Figure 3. Genes that are known to regulate cell-cycle progression and cell-cycle–dependent gene expression are labeled in purple. The color scale used to represent variations in transcript abundance is shown in the key at the bottom of the figure.
Figure 5
Genes in the DNA Damage Signature. The expression patterns of the genes that were substantially induced in response to both MMS and ionizing radiation (IR), but whose expression was largely unaffected in response to other environmental stresses, are shown as described in Figure 1. The color scale used to represent changes in transcript levels is shown in the key at the bottom of the figure.
Figure 6
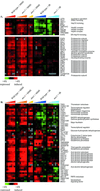
Mec1p controls the ESR in response to DNA damage. Representative genes induced in the ESR (A) or repressed in the ESR (B) are shown for the time points described in Figure 1, and 20 min after heat transfer. The color scale used to indicate changes in transcript abundance is shown at the bottom of each figure.
Figure 7
Genes induced specifically by MMS treatment. The expression pattern of genes encoding protein-folding chaperones and proteasome components (A), and targets of the transcription factor Yap1p (B), after MMS treatment and ionizing radiation (IR) are shown, organized according to the hierarchical cluster analysis of the complete data set. This figure omits a subset of the Yap1p targets that are induced in the ESR by other regulators (Gasch et al., 2000). The time points represented for the DNA damage responses are the same as described in Figure 1, and the color scale that represents the changes in transcript levels is shown in the key at the bottom left of each figure. Adjacent genes on this display that share high sequence similarity and may therefore be subject to cross-hybridization in the microarray analysis are indicated by an asterisk.
Figure 8
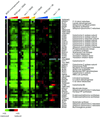
Genes repressed specifically by MMS treatment. The expression patterns of genes repressed by MMS treatment are shown after MMS exposure and ionizing radiation (IR). The genes are organized as seen in the hierarchical cluster of the entire DNA damage data set. The responses of these genes to ROX1 overexpression are also shown. Time points are the same as described in Figure 1, and the color scale key indicating the changes in transcript levels is shown at the bottom of the figure. Adjacent genes on this display that share high sequence similarity and may therefore be subject to cross-hybridization in the microarray analysis are indicated by an asterisk.
Figure 9
Summary of genomic responses to MMS and ionizing radiation. This diagram summarizes the functional features of the genomic expression responses observed in this study (purple), transcription factors (blue) and protein kinases (yellow) that have been implicated in those genomic responses, and the hypothetical cellular signals that trigger the responses (orange). Regulatory factors that were investigated in this study are indicated as colored ellipses.
Similar articles
- Spk1/Rad53 is regulated by Mec1-dependent protein phosphorylation in DNA replication and damage checkpoint pathways.
Sun Z, Fay DS, Marini F, Foiani M, Stern DF. Sun Z, et al. Genes Dev. 1996 Feb 15;10(4):395-406. doi: 10.1101/gad.10.4.395. Genes Dev. 1996. PMID: 8600024 - Characterization of mec1 kinase-deficient mutants and of new hypomorphic mec1 alleles impairing subsets of the DNA damage response pathway.
Paciotti V, Clerici M, Scotti M, Lucchini G, Longhese MP. Paciotti V, et al. Mol Cell Biol. 2001 Jun;21(12):3913-25. doi: 10.1128/MCB.21.12.3913-3925.2001. Mol Cell Biol. 2001. PMID: 11359899 Free PMC article. - Characterization of a novel DNA damage-inducible gene of Saccharomyces cerevisiae, DIN7, which is a structural homolog of the RAD2 and RAD27 DNA repair genes.
Mieczkowski PA, Fikus MU, Ciesla Z. Mieczkowski PA, et al. Mol Gen Genet. 1997 Feb 27;253(6):655-65. doi: 10.1007/s004380050369. Mol Gen Genet. 1997. PMID: 9079876 - Yet another job for Dna2: Checkpoint activation.
Wanrooij PH, Burgers PM. Wanrooij PH, et al. DNA Repair (Amst). 2015 Aug;32:17-23. doi: 10.1016/j.dnarep.2015.04.009. Epub 2015 May 1. DNA Repair (Amst). 2015. PMID: 25956863 Free PMC article. Review. - ATR/Mec1: coordinating fork stability and repair.
Friedel AM, Pike BL, Gasser SM. Friedel AM, et al. Curr Opin Cell Biol. 2009 Apr;21(2):237-44. doi: 10.1016/j.ceb.2009.01.017. Epub 2009 Feb 21. Curr Opin Cell Biol. 2009. PMID: 19230642 Review.
Cited by
- A gene ontology inferred from molecular networks.
Dutkowski J, Kramer M, Surma MA, Balakrishnan R, Cherry JM, Krogan NJ, Ideker T. Dutkowski J, et al. Nat Biotechnol. 2013 Jan;31(1):38-45. doi: 10.1038/nbt.2463. Nat Biotechnol. 2013. PMID: 23242164 Free PMC article. - The Modular Adaptive Ribosome.
Yadav A, Radhakrishnan A, Panda A, Singh A, Sinha H, Bhanot G. Yadav A, et al. PLoS One. 2016 Nov 3;11(11):e0166021. doi: 10.1371/journal.pone.0166021. eCollection 2016. PLoS One. 2016. PMID: 27812193 Free PMC article. - A classification-based framework for predicting and analyzing gene regulatory response.
Kundaje A, Middendorf M, Shah M, Wiggins CH, Freund Y, Leslie C. Kundaje A, et al. BMC Bioinformatics. 2006 Mar 20;7 Suppl 1(Suppl 1):S5. doi: 10.1186/1471-2105-7-S1-S5. BMC Bioinformatics. 2006. PMID: 16723008 Free PMC article. - Portrait of transcriptional responses to ultraviolet and ionizing radiation in human cells.
Rieger KE, Chu G. Rieger KE, et al. Nucleic Acids Res. 2004 Sep 8;32(16):4786-803. doi: 10.1093/nar/gkh783. Print 2004. Nucleic Acids Res. 2004. PMID: 15356296 Free PMC article. - Replication in hydroxyurea: it's a matter of time.
Alvino GM, Collingwood D, Murphy JM, Delrow J, Brewer BJ, Raghuraman MK. Alvino GM, et al. Mol Cell Biol. 2007 Sep;27(18):6396-406. doi: 10.1128/MCB.00719-07. Epub 2007 Jul 16. Mol Cell Biol. 2007. PMID: 17636020 Free PMC article.
References
- Allen JB, Zhou Z, Siede W, Friedberg EC, Elledge SJ. The SAD1/RAD53 protein kinase controls multiple checkpoints and DNA damage-induced transcription in yeast. Genes Dev. 1994;8:2401–2415. - PubMed
- Bachant JB, Elledge SJ. Mitotic treasures in the nucleolus. Nature. 1999;398:757–758. - PubMed
- Budd M, Mortimer RK. Repair of double-strand breaks in a temperature conditional radiation-sensitive mutant of Saccharomyces cerevisiae. Mutat Res. 1982;103:19–24. - PubMed
Publication types
MeSH terms
Substances
Grants and funding
- R01 GM046406/GM/NIGMS NIH HHS/United States
- R01 GM044664/GM/NIGMS NIH HHS/United States
- R37 GM046406/GM/NIGMS NIH HHS/United States
- GM-44664/GM/NIGMS NIH HHS/United States
- R37 GM044664/GM/NIGMS NIH HHS/United States
- HG-00983/HG/NHGRI NIH HHS/United States
- HG-00450/HG/NHGRI NIH HHS/United States
- GM-46406/GM/NIGMS NIH HHS/United States
LinkOut - more resources
Full Text Sources
Molecular Biology Databases
Miscellaneous
