c-Rel regulates interleukin 12 p70 expression in CD8(+) dendritic cells by specifically inducing p35 gene transcription - PubMed (original) (raw)
c-Rel regulates interleukin 12 p70 expression in CD8(+) dendritic cells by specifically inducing p35 gene transcription
R Grumont et al. J Exp Med. 2001.
Abstract
Interleukin 12 (IL-12) is a 70-kD proinflammatory cytokine produced by antigen presenting cells that is essential for the induction of T helper type 1 development. It comprises 35-kD (p35) and 40-kD (p40) polypeptides encoded by separate genes that are induced by a range of stimuli that include lipopolysaccharide (LPS), DNA, and CD40 ligand. To date, the regulation of IL-12 expression at the transcriptional level has mainly been examined in macrophages and restricted almost exclusively to the p40 gene. Here we show that in CD8(+) dendritic cells, major producers of IL-12 p70, the Rel/nuclear factor (NF)-kappaB signaling pathway is necessary for the induction of IL-12 in response to microbial stimuli. In contrast to macrophages which require c-Rel for p40 transcription, in CD8(+) dendritic cells, the induced expression of p35 rather than p40 by inactivated Staphylococcus aureus, DNA, or LPS is c-Rel dependent and regulated directly by c-Rel complexes binding to the p35 promoter. This data establishes the IL-12 p35 gene as a new target of c-Rel and shows that the regulation of IL-12 p70 expression at the transcriptional level by Rel/NF-kappaB is controlled through both the p35 and p40 genes in a cell type-specific fashion.
Figures
Figure 1
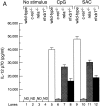
Production of IL-12 p70 but not p40 or (p40)2 is markedly reduced in c-rel − _/_− splenic DCs. (A) IL-12 production by splenic DCs isolated from Rel/NF-κB mutant mice. Equivalent numbers of mouse splenic CD11c+ DCs isolated from wild-type (lanes 1, 5, and 9), c-rel − _/_− (lanes 2, 6, and 10), and nfkb1 − _/_− (lanes 4, 8, and 12) mice or lethally irradiated C57BL6Ly5.1+ mice reconstituted with E13 rela − _/_− fetal liver cells (lanes 3, 7, and 11) were cultured in the absence of stimuli (lanes 1–4) or with either DNA containing CpG motifs (lanes 5–8) or inactivated SAC (lanes 9–12) in the presence of optimal concentrations of GM-CSF, IFN-γ, and IL-4 for 18 h. Supernatants were then assayed for IL-12 p70 content (pg/ml) using a p70-specific ELISA. The error bars represent the mean ± SD within a typical experiment, which was repeated four times with similar results. ND, refers to “not detectable” below a level of sensitivity of <15 pg/ml. (B) p40 and (p40)2 production by activated CD11c+ splenic DCs lacking different Rel/NF-κB proteins. p40 and (p40)2 levels in culture supernatants described in panel A, were analyzed by p40-specific ELISA. The combined amount of p40 and (p40)2 was determined by subtracting the IL-12 p70 reading obtained with the p70 ELISA from values obtained with the p40 ELISA. The combined level of p40 and (p40)2 (ng/ml) is typical of four independent experiments. The error bars represent the variation within the experiment. The level of p40/(p40)2 in unstimulated DCs (lanes 1–4) was ∼5 ng/ml.
Figure 7
Functional analysis of the murine p35 promoter. (A) LPS and DNA induced expression of p35 and p40 in the mouse cell line A7L.13. Total RNA isolated from A7L.13 cells that were untreated (lanes 1 and 4) or stimulated with LPS (lanes 2 and 5) or DNA (lanes 3 and 6) for 4 h was subjected to semiquantitative reverse transcription PCR using p35, p40, and _β-actin–_specific primers. PCR products were fractionated on a 1.5% agarose gel. (B) Schematic representation of the p35 gene 5′ flanking region and luciferase reporter plasmids. The numbers in parenthesis were assigned according to the transcriptional start site as determined by Tone et al. (reference 27).The open box represents a putative Rel/NF_-_κB binding site (κB, 5′-GGGGAATCCCT-3′:−63 to −54), while the corresponding symbol with a cross represents the mutated version (κBm, 5′-GTCAATAACT-3′) of this element. The arrow at position 0 denotes the major transcriptional initiation site. E1 and E2 refer to exons 1 and 2 respectively of the murine p35 gene. The cross-hatched boxes represent 5′-untranslated sequence in exons 1 and 2, while the filled portion of exon 2 corresponds to coding sequence. The location of the p35 initiation codon in exon 2 is also shown. The open box designated “luc” refers to the firefly luciferase gene. Plasmid nomenclature is indicated to the right of each construct. (C) The κB motif in the murine p35 promoter is necessary for c-Rel–dependent transcription. The J774 and A7L.13 cell lines were each transiently transfected with 1–2 μg of the reporter plasmid pluc (lanes 1, 2, 7, and 8), p35κB-luc (lanes 3, 4, 9, and 10), or p35κBm-luc (lanes 5, 6, 11, and 12) plus an equimolar amount of (∼10–12 μg) of the expression plasmid DAMP56 with no insert (lanes 1, 3, 5, 7, 9, and 11) or c-Rel (lanes 2, 4, 6, 8, 10, and 12). The promoter activity measured in extracts of transfected cells is displayed as relative luciferase units. The results represent the mean luciferase activity ± SD obtained from five separate sets of transient transfections.
Figure 2
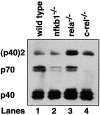
Western blotting of splenic DC supernatants. Supernatants from wild-type (lane 1), nfkb1 − _/_− (lane 2), rela − _/_− (lane 3), and c-rel − _/_− (lane 4) CD11c+ splenic DCs cultured for 18 h with SAC plus cytokines were subjected to nondenaturing electrophoresis and Western blotting using an anti–IL-12 p40-specific monoclonal antibody. p40, IL-12 p70, and (p40)2 are indicated. This result is representative of that obtained from three independent experiments.
Figure 3
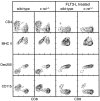
Splenic DC development in naive and FLT3 ligand treated c-rel − _/_− mice is normal. Splenic DCs purified from untreated and FLT3 ligand treated wild-type or c-rel − _/_− mice were stained with monoclonal antibodies specific for CD8 and CD4, MHC class II, DEC205, or CD11b and examined by flow cytometry. The data, displayed as contour plots, is representative of a typical experiment and was repeated three times.
Figure 4
IL-12 production by purified CD8+ DCs. Supernatants harvested from equivalent numbers of wild-type (lanes 2–4) or c-rel − _/_− (lanes 5–7) CD11c+ (lanes 4 and 7), CD8hi (lanes 2 and 5), and CD8int (lanes 3 and 6) splenic DCs stimulated in culture for 18 h, were fractionated on a non-denaturing acrylamide gel and proteins transferred to nitrocellulose membranes. p40, p70, and (p40)2 were all detected using an anti-IL-12 p40 monoclonal antibody. Purified p40, p70, and (p40)2 were used as standards (lane 1).
Figure 5
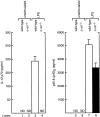
c-Rel is not essential for LPS induced p40 expression in CD8+ DCs. The level of IL-12 (lanes 1–4) and p40/(p40)2 (lanes 5–8) production by wild-type (lanes 1, 3, 5, and 7) and c-rel_−/_− (lanes 2, 4, 6, and 8) splenic DCs without activation (lanes 1, 2, 5, and 6) or upon stimulation with LPS for 18 h was assessed by ELISA. The error bars represent the mean ± SD within a typical experiment, which was repeated twice in triplicate with similar results. ND is an abbreviation for “not detectable,” with the limit of sensitivity for the detection of IL-12 p70 at less than 15 pg/ml. p40/(p40)2 levels in unstimulated cells were also below the limit of detection.
Figure 6
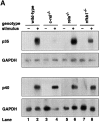
p35 but not p40 mRNA expression is markedly reduced in stimulated c-rel_−/_− CD8+ DCs. (A) p35 and p40 mRNA expression in CD8+ DCs from different Rel/NF-κB mutant mice. 5 μg samples of total RNA isolated from wild-type (lanes 1 and 2), c-rel − _/_− (lanes 3 and 4), rela − _/_− (lanes 5 and 6), or nfkb1 − _/_− (lanes 7 and 8) CD8+ splenic DCs that were unstimulated (lanes 1, 3, 5, and 7) or DNA treated (lanes 2, 4, 6, and 8) for 3 h, were analyzed by Northern blot hybridization. Filters were first hybridized with murine p35 or p40 cDNA probes, then rehybridized with a rat GAPDH probe. Filters were exposed to autoradiography for between 24 and 72 h. (B) LPS induced p35 and p40 mRNA expression in CD8+ DCs. 5 μg samples of total RNA isolated from wild-type (lanes 1 and 2) and c-rel_−/_− (lanes 3 and 4) DCs that were untreated (lanes 1 and 3) or LPS stimulated (lanes 2 and 4) for 3 h, were analyzed by Northern blot hybridization as outlined in panel A. Filters were exposed to autoradiography for 24 h (GAPDH) and 72 h (p35 and p40).
Figure 8
Rel/NF-κB DNA binding activity in DCs. Nuclear extracts (1–2 μg) isolated from purified normal and c-rel − _/_− splenic CD8+ DCs that were unstimulated or activated in culture with DNA for 2 h were incubated with a 32P-radiolabeled p35κB probe, resolved on 5% nondenaturing polyacrylamide gels, and exposed to autoradiography for 8–24 h at −70°C. (A) A nuclear complex induced in activated CD8+ DCs that binds the p35κB site is absent in c-rel − _/_− cells. Nuclear extracts from untreated (lanes 1, 3, 5, and 7) or activated (lanes 2, 4, 6, and 8) normal (lanes 1, 2, 5, and 6) and c-rel − _/_− (lanes 3, 4, 7, and 8) DCs were either incubated with a radiolabeled wild-type (lanes 1–4) or mutant (lanes 5–8) p35κB probe. C1 and C2 represent the fast and slower constitutive complexes respectively, while the inducible complex of slow mobility is designated C3. (B) The inducible C3 complex is a c-Rel/NF-κB1 heterodimer. Nuclear extracts from resting (lanes 1–4, 9–12) or activated 5 6 7 8 13 14 15 16 wild-type (lanes 1–8) and c-rel − _/_− (lanes 9–16) DCs were incubated with preimmune (lanes 1, 5, 9, and 13), NF-κB1 (lanes 2, 6, 10, and 14), c-Rel (lanes 3, 7, 11, and 15), or RelA (lanes 4, 8, 12, and 16)-specific antisera before adding the radiolabeled p35 κB probe.
Similar articles
- Differential regulation of interleukin (IL)-12 p35 and p40 gene expression and interferon (IFN)-gamma-primed IL-12 production by IFN regulatory factor 1.
Liu J, Cao S, Herman LM, Ma X. Liu J, et al. J Exp Med. 2003 Oct 20;198(8):1265-76. doi: 10.1084/jem.20030026. J Exp Med. 2003. PMID: 14568984 Free PMC article. - Selective requirement for c-Rel during IL-12 P40 gene induction in macrophages.
Sanjabi S, Hoffmann A, Liou HC, Baltimore D, Smale ST. Sanjabi S, et al. Proc Natl Acad Sci U S A. 2000 Nov 7;97(23):12705-10. doi: 10.1073/pnas.230436397. Proc Natl Acad Sci U S A. 2000. PMID: 11058167 Free PMC article. - A proximal kappaB site in the IL-23 p19 promoter is responsible for RelA- and c-Rel-dependent transcription.
Mise-Omata S, Kuroda E, Niikura J, Yamashita U, Obata Y, Doi TS. Mise-Omata S, et al. J Immunol. 2007 Nov 15;179(10):6596-603. doi: 10.4049/jimmunol.179.10.6596. J Immunol. 2007. PMID: 17982049 - The Th2 transcription factor c-Maf inhibits IL-12p35 gene expression in activated macrophages by targeting NF-kappaB nuclear translocation.
Homma Y, Cao S, Shi X, Ma X. Homma Y, et al. J Interferon Cytokine Res. 2007 Sep;27(9):799-808. doi: 10.1089/jir.2007.0006. J Interferon Cytokine Res. 2007. PMID: 17892401
Cited by
- A key role for NF-κB transcription factor c-Rel in T-lymphocyte-differentiation and effector functions.
Visekruna A, Volkov A, Steinhoff U. Visekruna A, et al. Clin Dev Immunol. 2012;2012:239368. doi: 10.1155/2012/239368. Epub 2012 Mar 6. Clin Dev Immunol. 2012. PMID: 22481964 Free PMC article. Review. - Differential regulation of interleukin (IL)-12 p35 and p40 gene expression and interferon (IFN)-gamma-primed IL-12 production by IFN regulatory factor 1.
Liu J, Cao S, Herman LM, Ma X. Liu J, et al. J Exp Med. 2003 Oct 20;198(8):1265-76. doi: 10.1084/jem.20030026. J Exp Med. 2003. PMID: 14568984 Free PMC article. - Interleukin 12 a key immunoregulatory cytokine in infection applications.
Hamza T, Barnett JB, Li B. Hamza T, et al. Int J Mol Sci. 2010 Feb 26;11(3):789-806. doi: 10.3390/ijms11030789. Int J Mol Sci. 2010. PMID: 20479986 Free PMC article. Review. - Tolerogenic Transcriptional Signatures of Steady-State and Pathogen-Induced Dendritic Cells.
Vendelova E, Ashour D, Blank P, Erhard F, Saliba AE, Kalinke U, Lutz MB. Vendelova E, et al. Front Immunol. 2018 Feb 28;9:333. doi: 10.3389/fimmu.2018.00333. eCollection 2018. Front Immunol. 2018. PMID: 29541071 Free PMC article. Review. - Differential role for c-Rel and C/EBPbeta/delta in TLR-mediated induction of proinflammatory cytokines.
Lu YC, Kim I, Lye E, Shen F, Suzuki N, Suzuki S, Gerondakis S, Akira S, Gaffen SL, Yeh WC, Ohashi PS. Lu YC, et al. J Immunol. 2009 Jun 1;182(11):7212-21. doi: 10.4049/jimmunol.0802971. J Immunol. 2009. PMID: 19454718 Free PMC article.
References
- Trinchieri G. Interleukin-12a cytokine at the interface of inflammation and immunity. Adv. Immunol. 1998;70:83–243. - PubMed
- Banchereau J., Steinman R.M. Dendritic cells and the control of immunity. Nature. 1998;392:245–252. - PubMed
- Steinman R.M., Pack M., Inaba K. Dendritic cells in the T-cell areas of lymphoid organs. Immunol. Rev. 1997;156:25–37. - PubMed
- Heufler C., Koch F., Stanzl U., Topar G., Wysocka M., Trinchieri G., Enk A., Steinman R.M., Romani N., Schuler G. Interleukin-12 is produced by dendritic cells and mediates T helper 1 development as well as interferon-gamma production by T helper 1 cells. Eur. J. Immunol. 1996;26:659–668. - PubMed
Publication types
MeSH terms
Substances
LinkOut - more resources
Full Text Sources
Other Literature Sources
Molecular Biology Databases
Research Materials
