Genome-wide analysis of the Drosophila immune response by using oligonucleotide microarrays - PubMed (original) (raw)
Genome-wide analysis of the Drosophila immune response by using oligonucleotide microarrays
E De Gregorio et al. Proc Natl Acad Sci U S A. 2001.
Abstract
To identify new Drosophila genes involved in the immune response, we monitored the gene expression profile of adult flies in response to microbial infection by using high-density oligonucleotide microarrays encompassing nearly the full Drosophila genome. Of 13,197 genes tested, we have characterized 230 induced and 170 repressed by microbial infection, most of which had not previously been associated with the immune response. Many of these genes can be assigned to specific aspects of the immune response, including recognition, phagocytosis, coagulation, melanization, activation of NF-kappaB transcription factors, synthesis of antimicrobial peptides, production of reactive oxygen species, and regulation of iron metabolism. Additionally, we found a large number of genes with unknown function that may be involved in control and execution of the immune response. Determining the function of these genes represents an important challenge for improving our knowledge of innate immunity. Complete results may be found at http://www.fruitfly.org/expression/immunity/.
Figures
Figure 1
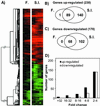
General statistics on the Drosophila immune-regulated genes. (A) Cluster image of the 400 DIRGs. The expression profiles after fungal natural infection (F.) and septic injury (S.I.) are shown. Columns correspond to different time points and rows to different genes. Red indicated increased mRNA levels, whereas green indicated decreased levels compared with uninfected flies. The brightest reds and greens are 6-fold induced and repressed, respectively. The graphs in B and C show the number of the genes induced (B) and repressed (C) responding to fungal natural infection (F.), septic injury (S.I.), or both. (D) Distribution of induced (white bars) and repressed (black bars) genes based on their fold change.
Figure 2
Drosophila melanization cascade. Schematic representation of the melanization cascade (see text for description) The Drosophila genes involved in the melanization pathway are indicated. Previously uncharacterized genes have names comprised of CG followed by a number (28); more information about these genes can be found in the FlyBase database (
). The numbers in parentheses represent the peak of activation within the expression profile (fold change compared to uninfected flies). =, no change in the expression levels; A, acute-phase gene; I, intermediate-phase gene.
Figure 3
Drosophila Toll and Imd pathways. Schematic representation of the Toll and Imd pathways (for more information see ref. 4). The numbers in parentheses correspond to the peak of activation within the expression profile (fold change compared to uninfected flies). A, acute-phase gene; L, late-response gene; b, gene regulated by bacterial infection; b + f, gene regulated by both bacterial and fungal infection. Imd encodes a protein with homology to RIP (P. Georgel, personal communication).
Similar articles
- Overview of innate immunity in Drosophila.
Kim T, Kim YJ. Kim T, et al. J Biochem Mol Biol. 2005 Mar 31;38(2):121-7. doi: 10.5483/bmbrep.2005.38.2.121. J Biochem Mol Biol. 2005. PMID: 15826489 Review. - Two proteases defining a melanization cascade in the immune system of Drosophila.
Tang H, Kambris Z, Lemaitre B, Hashimoto C. Tang H, et al. J Biol Chem. 2006 Sep 22;281(38):28097-104. doi: 10.1074/jbc.M601642200. Epub 2006 Jul 21. J Biol Chem. 2006. PMID: 16861233 - Regulation and function of the melanization reaction in Drosophila.
Tang H. Tang H. Fly (Austin). 2009 Jan-Mar;3(1):105-11. doi: 10.4161/fly.3.1.7747. Epub 2009 Jan 2. Fly (Austin). 2009. PMID: 19164947 Review. - Screening the fruitfly immune system.
Dionne MS, Schneider DS. Dionne MS, et al. Genome Biol. 2002;3(4):REVIEWS1010. doi: 10.1186/gb-2002-3-4-reviews1010. Epub 2002 Mar 27. Genome Biol. 2002. PMID: 11983063 Free PMC article. Review. - Methods to study Drosophila immunity.
Neyen C, Bretscher AJ, Binggeli O, Lemaitre B. Neyen C, et al. Methods. 2014 Jun 15;68(1):116-28. doi: 10.1016/j.ymeth.2014.02.023. Epub 2014 Mar 12. Methods. 2014. PMID: 24631888 Review.
Cited by
- Insect Innate Immunity Database (IIID): an annotation tool for identifying immune genes in insect genomes.
Brucker RM, Funkhouser LJ, Setia S, Pauly R, Bordenstein SR. Brucker RM, et al. PLoS One. 2012;7(9):e45125. doi: 10.1371/journal.pone.0045125. Epub 2012 Sep 12. PLoS One. 2012. PMID: 22984621 Free PMC article. - Reference Genome Sequences of the Oriental Armyworm, Mythimna separata (Lepidoptera: Noctuidae).
Yokoi K, Furukawa S, Zhou R, Jouraku A, Bono H. Yokoi K, et al. Insects. 2022 Dec 17;13(12):1172. doi: 10.3390/insects13121172. Insects. 2022. PMID: 36555082 Free PMC article. - Manduca sexta prophenoloxidase activating proteinase-1 (PAP-1) gene: organization, expression, and regulation by immune and hormonal signals.
Zou Z, Wang Y, Jiang H. Zou Z, et al. Insect Biochem Mol Biol. 2005 Jun;35(6):627-36. doi: 10.1016/j.ibmb.2005.02.004. Epub 2005 Mar 17. Insect Biochem Mol Biol. 2005. PMID: 15857768 Free PMC article. - Pyrosequencing and characterization of immune response genes from the American dog tick, Dermacentor variabilis (L.).
Jaworski DC, Zou Z, Bowen CJ, Wasala NB, Madden R, Wang Y, Kocan KM, Jiang H, Dillwith JW. Jaworski DC, et al. Insect Mol Biol. 2010 Oct;19(5):617-30. doi: 10.1111/j.1365-2583.2010.01037.x. Epub 2010 Aug 5. Insect Mol Biol. 2010. PMID: 20698900 Free PMC article. - Drosophila melanogaster is a genetically tractable model host for Mycobacterium marinum.
Dionne MS, Ghori N, Schneider DS. Dionne MS, et al. Infect Immun. 2003 Jun;71(6):3540-50. doi: 10.1128/IAI.71.6.3540-3550.2003. Infect Immun. 2003. PMID: 12761139 Free PMC article.
References
- Hoffmann J, Reichhart J. Trends Cell Biol. 1997;7:309–316. - PubMed
- Khush R S, Lemaitre B. Trends Genet. 2000;16:442–449. - PubMed
- Khush R S, Leulier F, Lemaitre B. Trends Immunol. 2001;5:260–264. - PubMed
Publication types
MeSH terms
Substances
LinkOut - more resources
Full Text Sources
Molecular Biology Databases


