Molecular mechanisms of beta-catenin recognition by adenomatous polyposis coli revealed by the structure of an APC-beta-catenin complex - PubMed (original) (raw)
Molecular mechanisms of beta-catenin recognition by adenomatous polyposis coli revealed by the structure of an APC-beta-catenin complex
K Eklof Spink et al. EMBO J. 2001.
Abstract
The adenomatous polyposis coli (APC) tumor suppressor protein plays a critical role in regulating cellular levels of the oncogene product beta-catenin. APC binds to beta-catenin through a series of homologous 15 and 20 amino acid repeats. We have determined the crystal structure of a 15 amino acid beta-catenin binding repeat from APC bound to the armadillo repeat region of beta-catenin. Although it lacks significant sequence homology, the N-terminal half of the repeat binds in a manner similar to portions of E-cadherin and XTcf3, but the remaining interactions are unique to APC. We discuss the implications of this new structure for the design of therapeutics, and present evidence from structural, biochemical and sequence data, which suggest that the 20 amino acid repeats can adopt two modes of binding to beta-catenin.
Figures
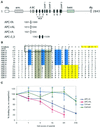
Fig. 1. The β-catenin-binding sites of APC. (A) Schematic of the APC primary structure. The conserved axin binding (SAMP1-3), oligomerization (olig.), armadillo repeat (arm.), basic and discs large interaction (dlg) regions are indicated. The 15 amino acid β-catenin-binding repeats are labeled A, B and C (white boxes). The 20 amino acid β-catenin-binding repeats are labeled 1–7 (black boxes). Truncations in the midpoint cluster region (MCR), which eliminate all of the axin-binding and most of the β-catenin-binding repeats, account for >60% of oncogenic mutations in APC (Miyoshi et al., 1992). The APC constructs used in binding experiments and crystallization are shown, with the beginning and end residue numbers in human APC indicated. (B) Alignment of the APC 15 and 20 amino acid repeats with E-cadherin and XTcf3. The alignment of the 15mers with E-cadherin and XTcf3 was performed based on the homologous regions of the E-cadherin–β-catenin, XTcf3–β-catenin and APC-rA–β-catenin structures (boxed). The 20mers were aligned with the 15mers based on alignment of the core homology regions. For an alternative alignment using the SLSSL sequences of E-cadherin and the 20mers, see Figure 4A, bottom panel. The residues that constitute the 15 and 20 amino acid repeat sequences are in bold. The homologous residues of the 15 and 20mer ‘core homology region’ are shaded gray; those conserved only in the 15mers are blue. The phosphorylation-specific binding motif of E-cadherin and the homologous APC 20mer sequences are highlighted in yellow. Beginning residue numbers based on the full-length proteins are indicated before the alignment. Residues from APC-rA that form contacts with β-catenin are indicated by asterisks (contacts by side chain only or main chain and side chain atoms) or plus signs (contacts by mainchain atoms only) above the alignment. hAPC-A, hAPC-B, hAPC-C: human APC 15mer repeats A, B and C. hAPC-D: hypothesized fourth human 15mer. dAPC-A, dAPC-B: Drosophila APC 15mers. eAPC-A, eAPC-B: Drosophila APC2 15mers. hAPC-1, hAPC-2, etc.: human APC 20mers. (C) Competition experiments to test the relative affinities of several β-catenin-binding peptides. GST-pulldown assays were performed using GST–β-catenin (full length) in the presence of a 5-fold excess of APC-fA. Increasing quantities of the APC-rA, APC-rAL, Tcf-ext or Cad-ext peptides were tested for their ability to compete with APC-fA for binding to limiting β-catenin. Fold molar excess of peptide (as compared with APC-fA) is plotted on the _x_-axis, as a pseudo log base-4 plot. APC-fA band intensities were quantified using the NIH Image program and are shown on the _y_-axis as percent of binding relative to that with no peptide competitor. Each point is plotted as mean ± SD of three experiments, except for the 256-fold excess of APC-rA, for which only two data points were obtained. APC-fA did not bind to GST alone (data not shown). See Materials and methods for details.
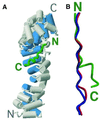
Fig. 2. Overall structure of the β-catenin–APC-rA complex. (A) Overall view of the β-catenin–APC-rA complex. Cylinders represent α-helices. β-catenin is gray, except for the H3 helices, which are blue. The Cα backbone trace of APC-rA is shown in green. The N- and C-terminus of each protein is labeled. (B) Comparison of the Cα backbone positions of β-catenin-bound APC-rA (green, APC residues 1021–1034), E-cadherin (blue, extended region residues 673–686) and XTcf3 (red, extended region residues 15–28). The figure was made by superimposing β-catenin in all three complexes using the LSQ function in O (Jones et al., 1991), and observing the relative positions of the three ligands. The N- and C-termini of APC-rA are indicated; E-cadherin and XTcf-3 are parallel to APC-rA. The figure was generated using Molscript and Raster3D (Kraulis, 1991; Merrit and Murphy, 1994).
Fig. 3. Interactions in the β-catenin–APC-rA complex. (A) Comparison of β-catenin-bound APC-rA, XTcf3 and E-cadherin in the core homology region of APC-rA. β-catenin residues are labeled in gray boxes. Other colors are as in Figure 2B. Contacts between APC-rA and β-catenin are drawn as solid lines (non-polar interactions), dotted lines (hydrogen bonds) or dashed lines (salt bridges). APC-rA residue numbers are indicated in green. (B) Comparison of β-catenin bound APC-rA, XTcf3 and E-cadherin in the region of the APC-rA bulge. Coloring and labeling is as in (A). Contacts of β-catenin with APC-rA are drawn in gray, and those with XTcf3 and E-cadherin in red. (C) Stabilizing forces in the APC-rA C-terminal bulge. β-catenin is drawn in a surface representation, colored blue for positive and red for negative electrostatic potential at the 10 kT/e level. The APC-rA peptide is colored by atom type with carbon white, oxygen red and nitrogen blue. Although no density is seen for the APC-rA Lys1030 or Asp1033 side chains in the structure, they are modeled (gray side chains) to demonstrate their likely interactions with regions of electrostatic potential on the surface of β-catenin. Hydrogen bonds between backbone and side chain atoms within the peptide are drawn as dotted lines. The Leu 1029 side chain is not shown for clarity. (A) and (B) were generated using Molscript and Raster3D (Kraulis, 1991; Merrit and Murphy, 1994).
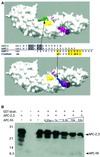
Fig. 4. Implications for APC 20mer binding. (A) Two potential modes for APC 20mer binding. β-catenin is shown as a surface representation. β-catenin residues whose mutation affected APC binding in previous experiments are colored. Those mutations that affected APC 20mer binding (Lys345, Trp383) (von Kries et al., 2000) are shown in yellow. Residues whose mutation affected binding of a construct containing both 15 and 20mer repeats (Lys312, Phe253, Phe293, Ala295, Ile296) are magenta. (Top panel) The β-catenin–APC-rA structure is used as a model for core homology region binding. The APC-rA Cα trace is drawn as a green tube. (Bottom panel) The SLSSL region of E-cadherin (residues 686–694) is shown in its binding site, as a model for SLSSL-region binding. The E-cadherin Cα trace is drawn as a blue tube. The sequence alignment between the panels shows human APC 20mer repeat 1 (hAPC-1) aligned with human APC 15mer repeat A (hAPC-A) and E-cadherin as would be predicted by each of the models. The relative positions of hAPC-A and E-cadherin have been preserved as in Figure 1B, and the hAPC-1 sequence is moved to align with each, demonstrating the two binding modes. Conserved core homology region residues are highlighted in gray, conserved SLSSL region residues in yellow. Arrows indicate the predicted position of hAPC-1 Ser1274 in each structural model. The binding sites for this residue in the two models are separated by more than 18 Å. (B) A construct containing a single 15mer repeat competes with a 20mer construct for binding to β-catenin. See Figure 1A for identification of the constructs used. Lane 1, 0.5 nmol APC-2,3; lane 2, 0.5 nmol APC-fA; lanes 3–8, GST-pulldown assays with constant GST-β-catenin and APC-2,3 and increasing amounts of competing APC-fA. Note: the maximum level of competitor contains 33 times more APC-fA than APC-2,3, or 16.5 times more 15mer repeats than 20mers. The antibody used for western blotting reacted poorly with the APC-fA construct, as it was generated to a fragment of APC containing only a 2 amino acid overlap with APC-fA. See Materials and methods for details.
Similar articles
- The structure of the beta-catenin/E-cadherin complex and the molecular basis of diverse ligand recognition by beta-catenin.
Huber AH, Weis WI. Huber AH, et al. Cell. 2001 May 4;105(3):391-402. doi: 10.1016/s0092-8674(01)00330-0. Cell. 2001. PMID: 11348595 - Crystal structure of a beta-catenin/APC complex reveals a critical role for APC phosphorylation in APC function.
Xing Y, Clements WK, Le Trong I, Hinds TR, Stenkamp R, Kimelman D, Xu W. Xing Y, et al. Mol Cell. 2004 Aug 27;15(4):523-33. doi: 10.1016/j.molcel.2004.08.001. Mol Cell. 2004. PMID: 15327769 - Structure of a human Tcf4-beta-catenin complex.
Poy F, Lepourcelet M, Shivdasani RA, Eck MJ. Poy F, et al. Nat Struct Biol. 2001 Dec;8(12):1053-7. doi: 10.1038/nsb720. Nat Struct Biol. 2001. PMID: 11713476 - The adenomatous polyposis coli (APC) tumor suppressor.
Polakis P. Polakis P. Biochim Biophys Acta. 1997 Jun 7;1332(3):F127-47. doi: 10.1016/s0304-419x(97)00008-5. Biochim Biophys Acta. 1997. PMID: 9196022 Review. - The ins and outs of APC and beta-catenin nuclear transport.
Henderson BR, Fagotto F. Henderson BR, et al. EMBO Rep. 2002 Sep;3(9):834-9. doi: 10.1093/embo-reports/kvf181. EMBO Rep. 2002. PMID: 12223464 Free PMC article. Review.
Cited by
- Multivalent tumor suppressor adenomatous polyposis coli promotes Axin biomolecular condensate formation and efficient β-catenin degradation.
Li TM, Ren J, Husmann D, Coan JP, Gozani O, Chua KF. Li TM, et al. Sci Rep. 2020 Oct 15;10(1):17425. doi: 10.1038/s41598-020-74080-2. Sci Rep. 2020. PMID: 33060621 Free PMC article. - Multivalent Interaction of Beta-Catenin With its Intrinsically Disordered Binding Partner Adenomatous Polyposis Coli.
Rowling PJE, Murton BL, Du Z, Itzhaki LS. Rowling PJE, et al. Front Mol Biosci. 2022 Jun 8;9:896493. doi: 10.3389/fmolb.2022.896493. eCollection 2022. Front Mol Biosci. 2022. PMID: 35755812 Free PMC article. - An RNAi-based chemical genetic screen identifies three small-molecule inhibitors of the Wnt/wingless signaling pathway.
Gonsalves FC, Klein K, Carson BB, Katz S, Ekas LA, Evans S, Nagourney R, Cardozo T, Brown AM, DasGupta R. Gonsalves FC, et al. Proc Natl Acad Sci U S A. 2011 Apr 12;108(15):5954-63. doi: 10.1073/pnas.1017496108. Epub 2011 Mar 10. Proc Natl Acad Sci U S A. 2011. PMID: 21393571 Free PMC article. - The many faces and functions of β-catenin.
Valenta T, Hausmann G, Basler K. Valenta T, et al. EMBO J. 2012 Jun 13;31(12):2714-36. doi: 10.1038/emboj.2012.150. Epub 2012 May 22. EMBO J. 2012. PMID: 22617422 Free PMC article. Review. - Purification, crystallization and preliminary X-ray diffraction studies of the β-catenin homolog HMP-2 from Caenorhabditis elegans.
Choi HJ, Weis WI. Choi HJ, et al. Acta Crystallogr F Struct Biol Commun. 2015 Mar;71(Pt 3):272-6. doi: 10.1107/S2053230X15000643. Epub 2015 Feb 19. Acta Crystallogr F Struct Biol Commun. 2015. PMID: 25760700 Free PMC article.
References
- Bailey T.L. and Gribskov,M. (1998) Combining evidence using p-values: application to sequence homology searches. [Comment in: Bioinformatics (2000) 16, 488–489 UI: 20330595]. Bioinformatics, 14, 48–54. - PubMed
- Behrens J., von Kries,J.P., Kuhl,M., Bruhn,L., Wedlich,D., Grosschedl,R. and Birchmeier,W. (1996) Functional interaction of β-catenin with the transcription factor LEF-1. Nature, 382, 638–642. - PubMed
- Behrens J., Jerchow,B.A., Würtele,M., Grimm,J., Asbrand,C., Wirtz,R., Kühl,M., Wedlich,D. and Birchmeier,W. (1998) Functional interaction of an axin homolog, conductin, with β-catenin, APC and GSK3β. Science, 280, 596–599. - PubMed
Publication types
MeSH terms
Substances
LinkOut - more resources
Full Text Sources
Molecular Biology Databases
Miscellaneous


