Structure of a fast kinesin: implications for ATPase mechanism and interactions with microtubules - PubMed (original) (raw)
Structure of a fast kinesin: implications for ATPase mechanism and interactions with microtubules
Y H Song et al. EMBO J. 2001.
Abstract
We determined the crystal structure of the motor domain of the fast fungal kinesin from Neurospora crassa (NcKin). The structure has several unique features. (i) Loop 11 in the switch 2 region is ordered and enables one to describe the complete nucleotide-binding pocket, including three inter-switch salt bridges between switch 1 and 2. (ii) Loop 9 in the switch 1 region bends outwards, making the nucleotide-binding pocket very wide. The displacement in switch 1 resembles that of the G-protein ras complexed with its guanosine nucleotide exchange factor. (iii) Loop 5 in the entrance to the nucleotide-binding pocket is remarkably long and interacts with the ribose of ATP. (iv) The linker and neck region is not well defined, indicating that it is mobile. (v) Image reconstructions of ice-embedded microtubules decorated with NcKin show that it interacts with several tubulin subunits, including a central beta-tubulin monomer and the two flanking alpha-tubulin monomers within the microtubule protofilament. Comparison of NcKin with other kinesins, myosin and G-proteins suggests that the rate-limiting step of ADP release is accelerated in the fungal kinesin and accounts for the unusually high velocity and ATPase activity.
Figures
Fig. 1. (A and B) Ribbon diagram of the NcKin355 showing the overall fold. (A) Front view; (B) rear view, from the MT-binding surface. It is a globular structure with a central β-sheet of eight strands (β1–β8) and three α-helices on either side. α-helices (α0–α3, α6) are in red, and β-strands are in blue. The elements putatively involved in MT binding are coloured in green (α4–L12–α5, L11). ADP is shown as a space-filling model. (C and D) Comparison between the structures of NcKin and kinesin from rat brain. (C) Front view; (D) rear view. The structures of the NcKin and RnKin monomer (PDB code: 2kin) were superimposed by aligning the residues of the P-loops (NcKin 81–92, RnKin 97–92). Only regions with substantial variations in structure are shown in colour, NcKin in red and RnKin in green. L11 is ordered in the NcKin structure and elongates the Sw2 helix (α4) to α4a and the strand β7 to β7a. Helix α3 becomes longer (three turns more than in the RnKin structure) and α3a shorter. The interruption of the helix α2 is also longer. The linker region β9–β10 and following helical neck α7 of RnKin adopt a more disordered conformation in NcKin.
Fig. 1. (A and B) Ribbon diagram of the NcKin355 showing the overall fold. (A) Front view; (B) rear view, from the MT-binding surface. It is a globular structure with a central β-sheet of eight strands (β1–β8) and three α-helices on either side. α-helices (α0–α3, α6) are in red, and β-strands are in blue. The elements putatively involved in MT binding are coloured in green (α4–L12–α5, L11). ADP is shown as a space-filling model. (C and D) Comparison between the structures of NcKin and kinesin from rat brain. (C) Front view; (D) rear view. The structures of the NcKin and RnKin monomer (PDB code: 2kin) were superimposed by aligning the residues of the P-loops (NcKin 81–92, RnKin 97–92). Only regions with substantial variations in structure are shown in colour, NcKin in red and RnKin in green. L11 is ordered in the NcKin structure and elongates the Sw2 helix (α4) to α4a and the strand β7 to β7a. Helix α3 becomes longer (three turns more than in the RnKin structure) and α3a shorter. The interruption of the helix α2 is also longer. The linker region β9–β10 and following helical neck α7 of RnKin adopt a more disordered conformation in NcKin.
Fig. 2. Comparisons between the Sw2 structures of NcKin (black) and Ncd (grey) in ribbon representations. The orientation of the view is the same as in Figure 1. The switch 2 helix α4 and the strand β are somewhat extended into the L11 region.
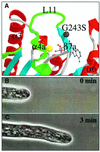
Fig. 3. Loop 11 and the growth rate of hyphae. (A) Conformation of L11 (residues 240–253), starting at strand β7a and ending at the short helix α4a, an extension of the switch 2 helix α4. Residue G243 is partly responsible for the high velocity of NcKin. (B and C) Growth of hyphae observed by phase-contrast microscopy. There is a time delay of 3 min between micrographs (B) and (C); the growth rate is 8.5 µm/min. Note the dark ‘Spitzenkörper’ at the tip.
Fig. 4. (A) Nucleotide-binding site and the coordination of ADP. Stereo diagram of the active site with bound ADP with its electron density, calculated as an omit map (_F_o – _F_c), and contoured at 1.5σ (see text). (B–D) The size of the nucleotide-binding pocket (stereo views). (B) Ribbon representation of the structure of NcKin. (C) Surface potential representation of the nucleotide-binding pocket of NcKin. (D) Kar3. The surface potentials are contoured according to the surface charge, with red denoting acidic and blue basic regions. The active site of NcKin is the most spacious among the known structures of kinesin motors. Figures were prepared using the programs SPOCK (Christopher, 1998) and Raster3d (Merrit, 1994); see Supplementary data.
Fig. 4. (A) Nucleotide-binding site and the coordination of ADP. Stereo diagram of the active site with bound ADP with its electron density, calculated as an omit map (_F_o – _F_c), and contoured at 1.5σ (see text). (B–D) The size of the nucleotide-binding pocket (stereo views). (B) Ribbon representation of the structure of NcKin. (C) Surface potential representation of the nucleotide-binding pocket of NcKin. (D) Kar3. The surface potentials are contoured according to the surface charge, with red denoting acidic and blue basic regions. The active site of NcKin is the most spacious among the known structures of kinesin motors. Figures were prepared using the programs SPOCK (Christopher, 1998) and Raster3d (Merrit, 1994); see Supplementary data.
Fig. 5. Comparisons of the Sw1 structure of different proteins of the kinesin family. (A) Superposition of the Sw1 structures of NcKin (red) versus RnKin (green) and HsKin (cyan). (B) Superposition of NcKin (red) versus Ncd (light blue) and Kar3 (blue). The orientation of this model is rotated 90° around the _y_-axis and 30° around the _x_-axis compared with the view in Figure 1A and B. Displacement of Sw1 as an essential step for nucleotide exchange. (C) Superposition of Kar3 and NcKin (only the P-loop and Sw1 are shown). The displacement of Sw1 (A197 in NcKin and A587 in Kar3) between the two structures is ∼15 Å. (D) Superposition of Ras-GTP and of the Ras–Sos structure. The displacement of Sw1 is also ∼15 Å, measured by the distance at residue Y32 (Boriack-Sjodin et al., 1998).
Fig. 5. Comparisons of the Sw1 structure of different proteins of the kinesin family. (A) Superposition of the Sw1 structures of NcKin (red) versus RnKin (green) and HsKin (cyan). (B) Superposition of NcKin (red) versus Ncd (light blue) and Kar3 (blue). The orientation of this model is rotated 90° around the _y_-axis and 30° around the _x_-axis compared with the view in Figure 1A and B. Displacement of Sw1 as an essential step for nucleotide exchange. (C) Superposition of Kar3 and NcKin (only the P-loop and Sw1 are shown). The displacement of Sw1 (A197 in NcKin and A587 in Kar3) between the two structures is ∼15 Å. (D) Superposition of Ras-GTP and of the Ras–Sos structure. The displacement of Sw1 is also ∼15 Å, measured by the distance at residue Y32 (Boriack-Sjodin et al., 1998).
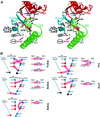
Fig. 6. Comparisons of salt bridges at the γ-phosphate-sensing region. (A) Stereo view of the superposition of NcKin (dark colour) and RnKin (pale colour). In NcKin, there are three inter-switch salt bridges and in RnKin there is only one. The salt bridge E97–K188 of RnKin cannot be formed in NcKin because at the corresponding positions there are no charged residues, which are Met99 and Gly191, respectively. (B) Summary of all known salt bridges of known kinesin structures.
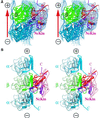
Fig. 7. Image reconstructions of MTs decorated with NcKin and interactions between them. Stereo views. (A) View from the side of a protofilament. Protein structures docked into the electron density are shown in green (β-tubulin), blue (α-tubulin) and grey/red (kinesin). The bound ADP is visible on the lower tip of kinesin. The bulk of the electron density of kinesin lies over a β-tubulin subunit, but there is some overlap with other subunits, especially the two flanking α-tubulin subunits within the same protofilament. (B) View from the side of a tubulin protofilament (i.e. tangential to the MT surface). Selected elements in the interacting regions are highlighted, α-helices as tubes, β-strands as ribbons. In NcKin, the elements L11, helix α4 (Sw2 region) and the region up to the C-terminus are purple, β4 and the β5/loop8 region (Sw1) are red. The tubulin subunits are blue (α-tubulin) and green (β-tubulin). The tubes show the near C-terminal helices H11 and H12, as well as helices H4, H5, H8 and adjacent loops. The C-terminal tail of tubulin (not visible in the structure due to disorder) has been drawn in arbitrary conformations in order to highlight potential interactions with kinesin (see text).
Similar articles
- The E-hook of tubulin interacts with kinesin's head to increase processivity and speed.
Lakämper S, Meyhöfer E. Lakämper S, et al. Biophys J. 2005 Nov;89(5):3223-34. doi: 10.1529/biophysj.104.057505. Epub 2005 Aug 12. Biophys J. 2005. PMID: 16100283 Free PMC article. - Unusual properties of the fungal conventional kinesin neck domain from Neurospora crassa.
Kallipolitou A, Deluca D, Majdic U, Lakämper S, Cross R, Meyhöfer E, Moroder L, Schliwa M, Woehlke G. Kallipolitou A, et al. EMBO J. 2001 Nov 15;20(22):6226-35. doi: 10.1093/emboj/20.22.6226. EMBO J. 2001. PMID: 11707394 Free PMC article. - A new look at the microtubule binding patterns of dimeric kinesins.
Hoenger A, Thormählen M, Diaz-Avalos R, Doerhoefer M, Goldie KN, Müller J, Mandelkow E. Hoenger A, et al. J Mol Biol. 2000 Apr 14;297(5):1087-103. doi: 10.1006/jmbi.2000.3627. J Mol Biol. 2000. PMID: 10764575 - The role of microtubules in processive kinesin movement.
Kikkawa M. Kikkawa M. Trends Cell Biol. 2008 Mar;18(3):128-35. doi: 10.1016/j.tcb.2008.01.002. Epub 2008 Feb 15. Trends Cell Biol. 2008. PMID: 18280159 Review. - Kinesin, 30 years later: Recent insights from structural studies.
Wang W, Cao L, Wang C, Gigant B, Knossow M. Wang W, et al. Protein Sci. 2015 Jul;24(7):1047-56. doi: 10.1002/pro.2697. Epub 2015 Jun 11. Protein Sci. 2015. PMID: 25975756 Free PMC article. Review.
Cited by
- Vik1 modulates microtubule-Kar3 interactions through a motor domain that lacks an active site.
Allingham JS, Sproul LR, Rayment I, Gilbert SP. Allingham JS, et al. Cell. 2007 Mar 23;128(6):1161-72. doi: 10.1016/j.cell.2006.12.046. Cell. 2007. PMID: 17382884 Free PMC article. - Single-molecule investigation of the interference between kinesin, tau and MAP2c.
Seitz A, Kojima H, Oiwa K, Mandelkow EM, Song YH, Mandelkow E. Seitz A, et al. EMBO J. 2002 Sep 16;21(18):4896-905. doi: 10.1093/emboj/cdf503. EMBO J. 2002. PMID: 12234929 Free PMC article. - A kinesin switch I arginine to lysine mutation rescues microtubule function.
Klumpp LM, Mackey AT, Farrell CM, Rosenberg JM, Gilbert SP. Klumpp LM, et al. J Biol Chem. 2003 Oct 3;278(40):39059-67. doi: 10.1074/jbc.M304250200. Epub 2003 Jul 14. J Biol Chem. 2003. PMID: 12860992 Free PMC article. - Review: regulation mechanisms of Kinesin-1.
Adio S, Reth J, Bathe F, Woehlke G. Adio S, et al. J Muscle Res Cell Motil. 2006;27(2):153-60. doi: 10.1007/s10974-005-9054-1. Epub 2006 Feb 1. J Muscle Res Cell Motil. 2006. PMID: 16450053 Review. - Probing the local dynamics of nucleotide-binding pocket coupled to the global dynamics: myosin versus kinesin.
Zheng W, Brooks BR. Zheng W, et al. Biophys J. 2005 Jul;89(1):167-78. doi: 10.1529/biophysj.105.063305. Epub 2005 May 6. Biophys J. 2005. PMID: 15879477 Free PMC article.
References
- Boriack-Sjodin P.A., Margarit,S.M., Bar-Sagi,D. and Kuriyan,J. (1998) The structural basis of the activation of Ras by Sos. Nature, 394, 337–343. - PubMed
- Brünger A.T. et al. (1998) Crystallography and NMR system: a new software suite for macromolecular structure determination. Acta Crystallogr. D, 54, 905–921. - PubMed
- Christopher J.A. (1998) SPOCK: The Structural Properties Observation and Calculation Kit (Program Manual). The Center for Macromolecular Design, Texas A&M University, College Station, TX.
- Coleman D.E. and Sprang,S.R. (1999) Reaction dynamics of G-protein catalyzed hydrolysis of GTP as viewed by X-ray crystallographic snapshots of Giα1. Methods Enzymol., 308, 70–92. - PubMed
Publication types
MeSH terms
Substances
LinkOut - more resources
Full Text Sources
Molecular Biology Databases


