Visualization of negative signaling in B cells by quantitative confocal microscopy - PubMed (original) (raw)
Visualization of negative signaling in B cells by quantitative confocal microscopy
H Phee et al. Mol Cell Biol. 2001 Dec.
Abstract
Numerous biochemical experiments have invoked a model in which B-cell antigen receptor (BCR)-Fc receptor for immunoglobulin (Ig) G (FcgammaRII) coclustering provides a dominant negative signal that blocks B-cell activation. Here, we tested this model using quantitative confocal microscopic techniques applied to ex vivo splenic B cells. We found that FcgammaRII and BCR colocalized with intact anti-Ig and that the SH2 domain-containing inositol 5'-phosphatase (SHIP) was recruited to the same site. Colocalization of BCR and SHIP was inefficient in FcgammaRII-/- but not gamma chain-/- splenic B cells. We also examined the subcellular location of a variety of enzymes and adapter proteins involved in signal transduction. Several proteins (CD19, CD22, SHP-1, and Dok) and a lipid raft marker were co-recruited to the BCR, regardless of the presence or absence of FcgammaRII and SHIP. Other proteins (Btk, Vav, Rac, and F-actin) displayed reduced colocalization with BCR in the presence of FcgammaRII and SHIP. Colocalization of BCR and F-actin required phosphatidylinositol (PtdIns) 3-kinase and was inhibited by SHIP, because the block in BCR/F-actin colocalization was not seen in B cells of SHIP-/- animals. Furthermore, BCR internalization was inhibited with intact anti-Ig stimulation or by expression of a dominant-negative mutant form of Rac. From these results, we propose that SHIP recruitment to BCR/FcgammaRII and the resulting hydrolysis of PtdIns-3,4,5-trisphosphate prevents the appropriate spatial redistribution and activation of enzymes distal to PtdIns 3-kinase, including those that promote Rac activation, actin polymerization, and receptor internalization.
Figures
FIG. 1
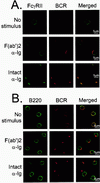
FcγRII and BCR colocalize under intact anti-Ig stimulation conditions. (A) Splenic B cells were stimulated with Cy5-labeled anti-Ig, either F(ab′)2 fragment [F(ab′)2 anti-Ig] or as intact antibody (intact anti-Ig). Cells were stimulated for 2 min and costained with FITC-labeled 2.4G2 to visualize FcγRII. FITC-labeled isotype antibody for 2.4G2 was used as a negative control for confocal microscopy (data not shown). Unstimulated samples (No stimulus) were fixed before staining with Cy5-labeled F(ab′)2 anti-Ig for 1 h at 4°C, washed twice, and stained with FITC-labeled 2.4G2. (B) B220 was visualized using FITC-conjugated anti-B220 antibodies. All cells were examined by confocal microscopy using argon and helium-neon lasers and visualized at mid-plane at ×100 magnification.
FIG. 2
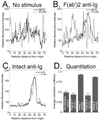
Quantitative analysis of confocal microscopy image. Confocal microscopic images were obtained from resting cells or cells stimulated with either F(ab′)2 or intact anti-Ig. Fluorescence intensities of positions around the perimeter of a single cell stained for BCR and FcγRII were determined. Fluorescence intensities were plotted for a single cell without stimulus (A), stimulated with F(ab′)2 anti-Ig (B), or stimulated with intact anti-Ig (C). (D) The degree of codistribution of two fluorochrome signals (FITC-labeled 2.4G2 and Cy5-labeled BCR) measured from single cells was assessed with correlation coefficients, as described in the text. The results shown are averages of correlation coefficients and standard errors from cells with no stimulus or F(ab′)2 or intact anti-Ig stimulus for 1 or 2 min. F(ab′)2 and intact anti-Ig treatments at each time point were statistically analyzed for significance of differences using the paired t test. For both cases, the P value was less than 0.0001.
FIG. 3
SHIP recruitment to the BCR-FcγRII coclustering site, (A) Colocalization of SHIP and BCR was examined by cytoplasmic staining of SHIP. Cells were unstimulated or stimulated for 2 min with F(ab′)2 or intact anti-Ig antibodies. The location of SHIP was examined by AlexaFluor 488-labeled anti-SHIP antibody. (B) Cytoplasmic staining of IκB was performed using biotinylated anti-IκB followed by streptavidin-AlexaFluor 488. (C) Average correlation coefficient for SHIP and BCR from cells unstimulated or stimulated with F(ab′)2 or intact anti-Ig stimulus for 1 or 2 min. N is number of cells examined for each experimental condition, and standard error is indicated as a bar. F(ab′)2 and intact anti-Ig treatment at each time point was analyzed for significance of difference as P value. For both cases the P value was less than 0.0001.
FIG. 4
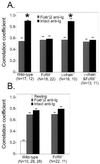
Differential recruitment of SHIP but not SHP-1 to FcγRII. (A) Splenic B cells were derived from wild-type animals or mice deficient in FcγRII, gamma chain, or both receptors. Subcellular locations of SHIP and BCR were visualized after stimulation with Cy5-labeled F(ab′)2 or intact anti-Ig. Confocal microscopic analysis was done as described for Fig. 2. Numbers of cells analyzed after F(ab′)2 or intact anti-Ig treatment are shown below the label. The asterisks indicate a significant difference with a P value of ≤0.0003. (B) Splenic B cells of wild-type or FcγRII−/− mice were stimulated with Cy5-labeled F(ab′)2 or intact anti-Ig, fixed, permeabilized, and stained with biotinylated SHP-1 antibody followed by streptavidin-FITC. The stimulated samples showed no significant difference.
FIG. 5
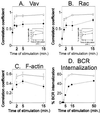
Differential recruitment of Vav, Rac, and F-actin to BCR and reduced BCR internalization under intact anti-Ig stimulation conditions. (A) Splenic B cells stimulated with Cy5-labeled F(ab′)2 or intact anti-Ig and stained with biotinylated anti-Vav antiserum were visualized by confocal microscopy and correlation coefficients were calculated. The inset shows the percentage of B cells exhibiting BCR cocapping with Vav, assessed visually by counting >100 cells. Correlation coefficient values of intact anti-Ig-stimulated samples at all time points showed a significant difference with P < 0.0001. (B) B cells were stimulated as in panel A, stained with anti-Rac antiserum, and analyzed for average correlation coefficients of the BCR and Rac. The inset shows the percentage of B cells exhibiting BCR cocapping with Rac, assessed visually by counting >100 cells. Correlation coefficient values of intact anti-Ig-stimulated samples at all time points showed a significant difference, with P < 0.0001. (C) B cells were stimulated as in panel A, stained with phalloidin, and analyzed for the average correlation coefficient of the BCR and F-actin. Correlation coefficient values of intact anti-Ig-stimulated samples at all time points showed a significant difference, with P < 0.0226. (D) A20 B cells were labeled with FITC-conjugated F(ab′)2 or intact anti-Ig and incubated at 37°C for the indicated times. The percent internalized BCR was derived as described in the text. (A to D) Open circles, F(ab′)2 stimulation; solid circles, intact anti-Ig stimulation.
FIG. 6
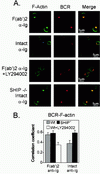
SHIP recruitment reduces PtdIns-3 kinase dependent colocalization of F-actin to BCR cap. (A) B cells from wild-type or SHIP−/− mice were stimulated with F(ab′)2 or intact anti-Ig in the presence or absence of 25 μM LY294002, as indicated. Cells were stained for BCR and F-actin as described for Fig. 5. (B) Codistribution of F-actin and BCR was examined as described in the text by correlation coefficient. Gray bar, wild-type B cells; black bars, SHIP−/− B cells. The white bar represents the average correlation coefficient of BCR and F-actin of splenic B cells treated with the PtdIns-3 kinase inhibitor LY294002.
FIG. 7
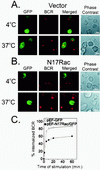
Rac is required for BCR internalization. (A) A20 cells were transfected with either GFP vector control (A) or dominant negative form of Rac (N17Rac-GFP) (B). After 24 h, Cy5-labeled F(ab′)2 anti-Ig was added for 30 min at 4°C. The anti-Ig-treated cells were held at 4°C or moved to 37°C for 10 min to permit receptor internalization. Internalized BCR was visualized using confocal microscopy. Cells appearing green represent those transfected with the GFP vector (A) or GFP-N17Rac (B). (C) To quantify receptor internalization from GFP vector- and N17Rac-GFP-transfected cells, cells were stimulated with unlabeled F(ab′)2 anti-Ig for the indicated times to allow internalization. The reactions were stopped using cold staining buffer, and remaining uninternalized BCR was labeled with Cy5-labeled F(ab′)2 anti-Ig and quantitated by flow cytometry. GFP-positive cells were gated, and mean fluorescence intensity of Cy5-labeled F(ab′)2 anti-Ig was measured at each time point. This value represented noninternalized BCR. Mean fluorescence intensity at 4°C was used to represent the total amount of BCR. Percent internalized BCR was measured as a loss of Cy5 fluorescence by subtracting noninternalized BCR from the total amount of BCR and divided by the total amount of BCR.
FIG. 8
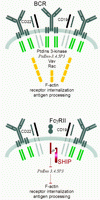
Model of inhibition of actin redistribution and receptor internalization by FcγRII-SHIP. Upon receptor clustering, the BCR forms a cap that includes CD22, CD19, and intracellular signaling molecules PtdIns 3-kinase, Vav, and Rac. BCR clustering activates PtdIns 3-kinase to form PtdIns-3,4,5-P3, which acts to recruit and stimulate Vav. Active Vav stimulates the small GTPase Rac to elicit actin reorganization. When FcγRII and SHIP are present with the BCR, formation of PtdIns-3,4,5-P3 is reduced, and hence all events distal to PtdIns-3,4,5-P3 are blocked.
Similar articles
- FcgammaRII expression on follicular dendritic cells and immunoreceptor tyrosine-based inhibition motif signaling in B cells.
Aydar Y, Wu J, Song J, Szakal AK, Tew JG. Aydar Y, et al. Eur J Immunol. 2004 Jan;34(1):98-107. doi: 10.1002/eji.200324147. Eur J Immunol. 2004. PMID: 14971035 - Fc gamma receptor IIb modulates the molecular Grb2 interaction network in activated B cells.
Neumann K, Oellerich T, Heine I, Urlaub H, Engelke M. Neumann K, et al. Cell Signal. 2011 May;23(5):893-900. doi: 10.1016/j.cellsig.2011.01.015. Epub 2011 Jan 22. Cell Signal. 2011. PMID: 21262349 - B Cell Receptor Signaling and Compartmentalization by Confocal Microscopy.
Mishra AR, Chaturvedi A. Mishra AR, et al. Methods Mol Biol. 2018;1707:121-129. doi: 10.1007/978-1-4939-7474-0_9. Methods Mol Biol. 2018. PMID: 29388104 Review. - Atypical Response of B-1 Cells to BCR Ligation: A Speculative Model.
Holodick NE, Rothstein TL. Holodick NE, et al. Front Immunol. 2013 Dec 16;4:457. doi: 10.3389/fimmu.2013.00457. Front Immunol. 2013. PMID: 24379817 Free PMC article. Review.
Cited by
- PI3Ks in lymphocyte signaling and development.
Okkenhaug K, Fruman DA. Okkenhaug K, et al. Curr Top Microbiol Immunol. 2010;346:57-85. doi: 10.1007/82_2010_45. Curr Top Microbiol Immunol. 2010. PMID: 20563708 Free PMC article. Review. - The growth of B cell receptor microcluster is a universal response of B cells encountering antigens with different motion features.
Wan Z, Liu W. Wan Z, et al. Protein Cell. 2012 Jul;3(7):545-58. doi: 10.1007/s13238-012-2054-1. Epub 2012 Jul 10. Protein Cell. 2012. PMID: 22773344 Free PMC article. - Death by a B cell superantigen: In vivo VH-targeted apoptotic supraclonal B cell deletion by a Staphylococcal Toxin.
Goodyear CS, Silverman GJ. Goodyear CS, et al. J Exp Med. 2003 May 5;197(9):1125-39. doi: 10.1084/jem.20020552. Epub 2003 Apr 28. J Exp Med. 2003. PMID: 12719481 Free PMC article. - Cbl-b negatively regulates B cell antigen receptor signaling in mature B cells through ubiquitination of the tyrosine kinase Syk.
Sohn HW, Gu H, Pierce SK. Sohn HW, et al. J Exp Med. 2003 Jun 2;197(11):1511-24. doi: 10.1084/jem.20021686. Epub 2003 May 27. J Exp Med. 2003. PMID: 12771181 Free PMC article. - B cell receptor signal transduction in the GC is short-circuited by high phosphatase activity.
Khalil AM, Cambier JC, Shlomchik MJ. Khalil AM, et al. Science. 2012 Jun 1;336(6085):1178-81. doi: 10.1126/science.1213368. Epub 2012 May 3. Science. 2012. PMID: 22555432 Free PMC article.
References
- Blasioli J, Paust S, Thomas M L. Definition of the sites of interaction between the protein tyrosine phosphatase SHP-1 and CD22. J Biol Chem. 1999;274:2303–2307. - PubMed
- Brown B K, Song W. The actin cytoskeleton is required for the trafficking of the B-cell antigen receptor to the late endosomes. Traffic. 2001;2:414–427. - PubMed
- Carter R H, Doody G M, Bolen J B, Fearon D T. Membrane IgM-induced tyrosine phosphorylation of CD19 requires a CD19 domain that mediates association with components of the B-cell antigen receptor complex. J Immunol. 1997;158:3062–3069. - PubMed
- Chacko G W, Tridandapani S, Damen J, Liu L, Krystal G, Coggeshall K M. Negative signaling in B-lymphocytes induces tyrosine phosphorylation of the 145 kDa inositol polyphosphate 5-phosphatase, SHIP. J Immunol. 1996;157:2234–2238. - PubMed
Publication types
MeSH terms
Substances
LinkOut - more resources
Full Text Sources
Other Literature Sources
Miscellaneous
