Atrogin-1, a muscle-specific F-box protein highly expressed during muscle atrophy - PubMed (original) (raw)
. 2001 Dec 4;98(25):14440-5.
doi: 10.1073/pnas.251541198. Epub 2001 Nov 20.
Collaborators, Affiliations
- PMID: 11717410
- PMCID: PMC64700
- DOI: 10.1073/pnas.251541198
Atrogin-1, a muscle-specific F-box protein highly expressed during muscle atrophy
M D Gomes et al. Proc Natl Acad Sci U S A. 2001.
Abstract
Muscle wasting is a debilitating consequence of fasting, inactivity, cancer, and other systemic diseases that results primarily from accelerated protein degradation by the ubiquitin-proteasome pathway. To identify key factors in this process, we have used cDNA microarrays to compare normal and atrophying muscles and found a unique gene fragment that is induced more than ninefold in muscles of fasted mice. We cloned this gene, which is expressed specifically in striated muscles. Because this mRNA also markedly increases in muscles atrophying because of diabetes, cancer, and renal failure, we named it atrogin-1. It contains a functional F-box domain that binds to Skp1 and thereby to Roc1 and Cul1, the other components of SCF-type Ub-protein ligases (E3s), as well as a nuclear localization sequence and PDZ-binding domain. On fasting, atrogin-1 mRNA levels increase specifically in skeletal muscle and before atrophy occurs. Atrogin-1 is one of the few examples of an F-box protein or Ub-protein ligase (E3) expressed in a tissue-specific manner and appears to be a critical component in the enhanced proteolysis leading to muscle atrophy in diverse diseases.
Figures
Figure 1
The atrogin-1 gene. (A) Sequences. The deduced amino acid sequence of the encoded polypeptide is shown in single-letter code below the nucleotide sequence in bold face type and is numbered beginning with the initiating methionine. Nucleotides are numbered in the 5′ to 3′ direction. The asterisk denotes the 3′-terminal stop codon. Residues constituting the F-Box motif, bipartite nuclear localization sequence, cytochrome c family heme-binding site signature, and PDZ domain are underlined, double underlined, dot dashed, and stricken-through respectively. A sequence matching the Kozak consensus that precedes the initiating methionine is dotted. (B) Schematic illustration of atrogin-1 protein. (C) Phylogenetic tree generated with Lasergene
megalign
software. C. elegans (Ce),D. melanogaster (Dm), and Mus musculus(Mm). (D) The family of atrogin-1 proteins. Multiple alignment of the amino acid sequences of the F-box motifs for representative members of the atrogin-1 superfamily. The consensus sequence at the top was based on conservation of a residue at any given position in >75% of sequences. Amino acids that differ from the consensus or majority sequence are denoted by (·). The GenBank accession no. for Mm atrogin-1 is NP_080622.1; for Mm FBX025, NP_080061; for Dy3.6, CAB09415; and for cg11658, AAF50023. (E) Association between atrogin-1 and Skp1. (Upper) The 293T cells were cotransfected with constructs encoding wild-type GST-atrogin-1 and Myc5-Skp1 (lane 1), GST-atrogin-13A and Myc5-Skp1 (lane 2), and ΔFb-atrogin-1 and Myc5-Skp1 (lane 3). Lysates were subjected to GST tag pull-down assay by using glutathione-Sepharose beads, and then the Myc5-Skp1 proteins were detected by using an anti-Myc antibody. (Lower) The membranes were also stripped and reprobed with anti-GST antibody to show that similar amounts of GST-tagged proteins were expressed.
Figure 2
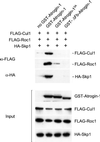
Formation in vivo of the SCFatrogin-1complex. (Upper) The 293T cells were cotransfected with constructs encoding SCF components (HA-Skp1, FLAG-Cul1, and FLAG-Roc1) with and without different GST-tagged versions of atrogin-1 [no GST-atrogin-1 (lane 1), GST-atrogin-1 (lane 2), GST-atrogin-13A (lane 3), and GST-ΔFb-atrogin-1 (lane 4)]. Lysates were subjected to GST coprecipitation by using glutathione-Sepharose beads, and then the FLAG-Cul1 and FLAG-Roc1 proteins were detected by using an anti-FLAG antibody. The membrane was stripped and reprobed with an anti-HA antibody to detect HA-Skp1. (Lower) Western blots of total cell lysates to show that similar amounts of GST-atrogin-1, GST-atrogin-13A, GST-ΔFb-atrogin-1, FLAG-Cul1, FLAG-Roc1, and HA-Skp1 proteins were expressed.
Figure 3
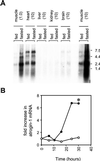
(A) Tissue distribution of atrogin-1. Total RNA was extracted from the pooled tissues of eight control or eight, 2 d food-deprived mice by using TRIzol reagent. RNA was electrophoresed on a 0.8% formaldehyde-agarose gel, transferred to a Zeta-Probe membrane (Bio-Rad), and UV crosslinked. The quantity of RNA loaded (in micrograms) for each tissue is in parentheses. A gel-purified_Kpn_I/_Xba_I fragment of the atrogin-1-coding sequence (bp 1,500–2,368) was used as a probe for the atrogin-1 transcripts. The probe was labeled by random priming (Prime-It Kit, Stratagene). Hybridization was performed by the method of Church and Gilbert (17) at 65°C. Hybridized membranes were analyzed by using a Fuji Phosphorimager. Blots were stripped and rehybridizing with a mouse glyceraldehyde-3-phosphate dehydrogenase probe (GAPDH, Ambion, Austin, TX) to ensure equivalent gel loading. (B) Time course of atrogin-1 expression in gastrocnemius muscle. The 48 C57BL6 mice were split into two groups at time = 0: 24 animals were transferred to cages without solid food, whereas the remaining 24 animals were maintained with food. At indicated times, four animals from each group were killed, gastrocnemius muscles weighed, and total RNA extracted by using TRIzol reagent. Northern blots were performed as above by using 10 μg of total RNA/lane from the pooled control and fasted muscle at each time point. Atrogin-1 band intensities were quantitated by densitometry, and membranes reprobed with a mouse GAPDH probe to ensure equal RNA loading. The fold increase in atrogin-1 mRNA was derived by dividing the corrected atrogin-1 band intensity (atrogin-1/GAPDH) at each time point with the corrected band intensity at t = 0. ○ fed; ● fasted. *, Muscle weight loss was significantly greater (P < 0.05) in fasted compared to fed animals after 30 h but not earlier time points (see text).
Figure 4
Atrogin-1 expression in muscles atrophying because of different diseases. Total RNA was prepared from the gastrocnemius muscles of control and 2 d food deprived mice, control and 3-d streptozotocin-treated rats, control and rats bearing Yoshida ascites hepatoma for 6 d, and control and 5/6 nephrectomized rats. Previous studies have shown enhanced protein degradation in these animal models (–20). Northern blots (10 μg of total RNA per lane) were preformed exactly as in Fig. 3.
Similar articles
- FBXO25, an F-box protein homologue of atrogin-1, is not induced in atrophying muscle.
Maragno AL, Baqui MM, Gomes MD. Maragno AL, et al. Biochim Biophys Acta. 2006 Jun;1760(6):966-72. doi: 10.1016/j.bbagen.2006.03.020. Epub 2006 Apr 4. Biochim Biophys Acta. 2006. PMID: 16714087 - Foxo transcription factors induce the atrophy-related ubiquitin ligase atrogin-1 and cause skeletal muscle atrophy.
Sandri M, Sandri C, Gilbert A, Skurk C, Calabria E, Picard A, Walsh K, Schiaffino S, Lecker SH, Goldberg AL. Sandri M, et al. Cell. 2004 Apr 30;117(3):399-412. doi: 10.1016/s0092-8674(04)00400-3. Cell. 2004. PMID: 15109499 Free PMC article. - Muscle-specific E3 ubiquitin ligases are involved in muscle atrophy of cancer cachexia: an in vitro and in vivo study.
Yuan L, Han J, Meng Q, Xi Q, Zhuang Q, Jiang Y, Han Y, Zhang B, Fang J, Wu G. Yuan L, et al. Oncol Rep. 2015 May;33(5):2261-8. doi: 10.3892/or.2015.3845. Epub 2015 Mar 9. Oncol Rep. 2015. PMID: 25760630 - Ubiquitin-protein ligases in muscle wasting: multiple parallel pathways?
Lecker SH. Lecker SH. Curr Opin Clin Nutr Metab Care. 2003 May;6(3):271-5. doi: 10.1097/01.mco.0000068963.34812.e5. Curr Opin Clin Nutr Metab Care. 2003. PMID: 12690258 Review. - Skeletal muscle atrophy and the E3 ubiquitin ligases MuRF1 and MAFbx/atrogin-1.
Bodine SC, Baehr LM. Bodine SC, et al. Am J Physiol Endocrinol Metab. 2014 Sep 15;307(6):E469-84. doi: 10.1152/ajpendo.00204.2014. Epub 2014 Aug 5. Am J Physiol Endocrinol Metab. 2014. PMID: 25096180 Free PMC article. Review.
Cited by
- The Role of Autophagy in Skeletal Muscle Diseases.
Xia Q, Huang X, Huang J, Zheng Y, March ME, Li J, Wei Y. Xia Q, et al. Front Physiol. 2021 Mar 25;12:638983. doi: 10.3389/fphys.2021.638983. eCollection 2021. Front Physiol. 2021. PMID: 33841177 Free PMC article. Review. - Genomic and proteomic profiling reveals reduced mitochondrial function and disruption of the neuromuscular junction driving rat sarcopenia.
Ibebunjo C, Chick JM, Kendall T, Eash JK, Li C, Zhang Y, Vickers C, Wu Z, Clarke BA, Shi J, Cruz J, Fournier B, Brachat S, Gutzwiller S, Ma Q, Markovits J, Broome M, Steinkrauss M, Skuba E, Galarneau JR, Gygi SP, Glass DJ. Ibebunjo C, et al. Mol Cell Biol. 2013 Jan;33(2):194-212. doi: 10.1128/MCB.01036-12. Epub 2012 Oct 29. Mol Cell Biol. 2013. PMID: 23109432 Free PMC article. - An extract of Artemisia dracunculus L. inhibits ubiquitin-proteasome activity and preserves skeletal muscle mass in a murine model of diabetes.
Kirk-Ballard H, Wang ZQ, Acharya P, Zhang XH, Yu Y, Kilroy G, Ribnicky D, Cefalu WT, Floyd ZE. Kirk-Ballard H, et al. PLoS One. 2013;8(2):e57112. doi: 10.1371/journal.pone.0057112. Epub 2013 Feb 20. PLoS One. 2013. PMID: 23437325 Free PMC article. - Overexpression of inducible 70-kDa heat shock protein in mouse improves structural and functional recovery of skeletal muscles from atrophy.
Miyabara EH, Nascimento TL, Rodrigues DC, Moriscot AS, Davila WF, AitMou Y, deTombe PP, Mestril R. Miyabara EH, et al. Pflugers Arch. 2012 Apr;463(5):733-41. doi: 10.1007/s00424-012-1087-x. Epub 2012 Mar 6. Pflugers Arch. 2012. PMID: 22391802 Free PMC article. - Skeletal Lipocalin-2 Is Associated with Iron-Related Oxidative Stress in ob/ob Mice with Sarcopenia.
Choi EB, Jeong JH, Jang HM, Ahn YJ, Kim KH, An HS, Lee JY, Jeong EA, Lee J, Shin HJ, Kim KE, Roh GS. Choi EB, et al. Antioxidants (Basel). 2021 May 11;10(5):758. doi: 10.3390/antiox10050758. Antioxidants (Basel). 2021. PMID: 34064680 Free PMC article.
References
- Kettelhut I C, Wing S S, Goldberg A L. Diabetes Metab Rev. 1988;4:751–772. - PubMed
- Lecker S H, Solomon V, Mitch W E, Goldberg A L. J Nutr. 1999;129:227S–237S. - PubMed
- Mitch W E, Goldberg A L. N Engl J Med. 1996;335:1897–1905. - PubMed
- Jaspers S R, Tischler M E. J Appl Physiol. 1984;57:1472–1479. - PubMed
- Tischler M E, Rosenberg S, Satarug S, Henriksen E J, Kirby C R, Tome M, Chase P. Metabolism. 1990;39:756–763. - PubMed
Publication types
MeSH terms
Substances
LinkOut - more resources
Full Text Sources
Other Literature Sources
Molecular Biology Databases


