Predictors of progression in Barrett's esophagus III: baseline flow cytometric variables - PubMed (original) (raw)
Predictors of progression in Barrett's esophagus III: baseline flow cytometric variables
P S Rabinovitch et al. Am J Gastroenterol. 2001 Nov.
Abstract
Objectives: Barrett's esophagus develops in 5-10% of patients with gastroesophageal reflux disease and predisposes to esophageal adenocarcinoma. We have previously shown that a systematic baseline endoscopic biopsy protocol using flow cytometry with histology identifies subsets of patients with Barrett's esophagus at low and high risk for progression to cancer. In this report, we further examined cytometric variables to better define the characteristics that best enable DNA cytometry to help predict cancer outcome.
Methods: Patients were prospectively evaluated using a systematic endoscopic biopsy protocol, with baseline histological and flow cytometric measurements as predictors and with cancer as the outcome.
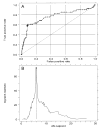
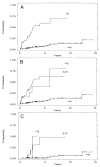
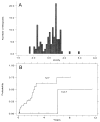
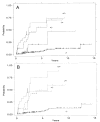
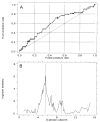
Results: A receiver operating curve analysis demonstrated that a 4N fraction cut point of 6% was optimal to discriminate cancer risk (relative risk [RR] = 11.7, 95% CI = 6.2-22). The 4N fractions of 6-15% were just as predictive of cancer as were fractions of >15%. We found that only aneuploid DNA contents of >2.7N were predictive of cancer (RR = 9.5, CI = 4.9-18), whereas those patients whose sole abnormality was an aneuploid population with DNA content of < or =2.7 had a low risk for progression. The presence of both 4N fraction of >6% and aneuploid DNA content of >2.7N was highly predictive of cancer (RR = 23, CI = 10-50). S phase was a predictor of cancer risk (RR = 2.3, CI = 1.2-4.4) but was not significant when high-grade dysplasia was accounted for.
Conclusions: Flow cytometry is a useful adjunct to histology in assessing cancer risk in patients with Barrett's esophagus. Careful examination of cytometric variables revealed a better definition of those parameters that are most closely associated with increased cancer risk.
Figures
Figure 1
(A) Receiver operating characteristic (ROC) curve for prediction of cancer outcome by 4N fractions. The large cross indicates a cut point of 6%. Area under ROC curve is 0.76. (B) Plot of two-sample log-rank test statistic for cancer outcome as a function of 4N cut point. Vertical line marks maximal χ2 at 6%.
Figure 2
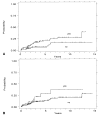
Cumulative incidence of cancer by 4N category. (A) Patients with a 4N fraction of >6% vs <6%. _(B)_ 4N categories of <6% _vs_ 6–15% _vs_ >15%. (C) 4N categories of <6% _vs_ 6–15% _vs_ >15% only in subset of patients without HGD. Note that the number of patients is small in the latter two groups (13 and three).
Figure 3
(A) Distribution of DNA ploidy values for aneuploid biopsies seen in study patients (123 aneuploid populations from 45 patients). (B) Cumulative cancer incidence for patients with at least one aneuploid DNA content <2.7N, vs those having all observed DNA contents 32.7N.
Figure 4
Cumulative incidence of cancer by ploidy category: presence (+) or absence (−) of aneuploidy/presence (+) or absence (−) of elevated 4N fractions. Analyses are performed with (A) any aneuploid DNA content included, and (B) near-diploid DNA contents (<2.7N) excluded from the aneuploid category.
Figure 5
(A) Receiver operating characteristic (ROC) curve analysis of the prediction cancer outcome by S-phase fractions according to cut point. The two large crosses indicate cut points of 5.5% and 9%. (B) Two-sample test for cancer outcome by S-phase cut point. Vertical lines mark potential χ2 maxima at 5.5% and 9%.
Figure 6
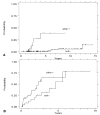
Cumulative incidence of cancer by presence of elevated S phase. (A) Cancer incidence for patients with vs without an S-phase fraction of >5.5%. (B) Cancer incidence for patients with vs without an S-phase fraction >9%.
Figure 7
(A) Cumulative incidence of cancer in patients with baseline endoscopy-negative, indefinite, or low-grade dysplasia histology with neither aneuploid DNA content > 2.7N nor 4N fraction > 6% (both −), or with either of these two cytometric findings (either +). (B) Corresponding analysis of patients with baseline high-grade dysplasia.
Similar articles
- Predictors of progression to cancer in Barrett's esophagus: baseline histology and flow cytometry identify low- and high-risk patient subsets.
Reid BJ, Levine DS, Longton G, Blount PL, Rabinovitch PS. Reid BJ, et al. Am J Gastroenterol. 2000 Jul;95(7):1669-76. doi: 10.1111/j.1572-0241.2000.02196.x. Am J Gastroenterol. 2000. PMID: 10925966 Free PMC article. - [Flow cytometric analysis of cellular DNA content in Barret's esophagus. A study of 66 cases].
Robaszkiewicz M, Hardy E, Volant A, Nousbaum JB, Cauvin JM, Calament G, Robert FX, Saleun JP, Gouerou H. Robaszkiewicz M, et al. Gastroenterol Clin Biol. 1991;15(10):703-10. Gastroenterol Clin Biol. 1991. PMID: 1816011 Review. French. - Progression to cancer in Barrett's esophagus is associated with genomic instability.
Rabinovitch PS, Reid BJ, Haggitt RC, Norwood TH, Rubin CE. Rabinovitch PS, et al. Lab Invest. 1989 Jan;60(1):65-71. Lab Invest. 1989. PMID: 2911184 - Barrett's esophagus and esophageal adenocarcinoma.
Reid BJ. Reid BJ. Gastroenterol Clin North Am. 1991 Dec;20(4):817-34. Gastroenterol Clin North Am. 1991. PMID: 1787015 Review.
Cited by
- Establishment of proliferative tetraploid cells from normal human fibroblasts.
Ohshima S, Seyama A. Ohshima S, et al. Front Oncol. 2013 Aug 1;3:198. doi: 10.3389/fonc.2013.00198. eCollection 2013. Front Oncol. 2013. PMID: 23914348 Free PMC article. - Biomarkers in the molecular pathogenesis of esophageal (Barrett) adenocarcinoma.
Williams LJ, Guernsey DL, Casson AG. Williams LJ, et al. Curr Oncol. 2006 Feb;13(1):33-43. doi: 10.3747/co.v13i1.76. Curr Oncol. 2006. PMID: 17576439 Free PMC article. - A biomarker panel predicts progression of Barrett's esophagus to esophageal adenocarcinoma.
Duits LC, Lao-Sirieix P, Wolf WA, O'Donovan M, Galeano-Dalmau N, Meijer SL, Offerhaus GJA, Redman J, Crawte J, Zeki S, Pouw RE, Chak A, Shaheen NJ, Bergman JJGHM, Fitzgerald RC. Duits LC, et al. Dis Esophagus. 2019 Jan 1;32(1):doy102. doi: 10.1093/dote/doy102. Dis Esophagus. 2019. PMID: 30496496 Free PMC article. - Nonadenomatous dysplasia in barrett esophagus: a clinical, pathologic, and DNA content flow cytometric study.
Rucker-Schmidt RL, Sanchez CA, Blount PL, Ayub K, Li X, Rabinovitch PS, Reid BJ, Odze RD. Rucker-Schmidt RL, et al. Am J Surg Pathol. 2009 Jun;33(6):886-93. doi: 10.1097/PAS.0b013e318198a1d4. Am J Surg Pathol. 2009. PMID: 19194279 Free PMC article. - Surrogate Markers: Lessons from the Next Gen?
Reid BJ. Reid BJ. Cancer Prev Res (Phila). 2016 Jul;9(7):512-7. doi: 10.1158/1940-6207.CAPR-16-0059. Epub 2016 May 2. Cancer Prev Res (Phila). 2016. PMID: 27138791 Free PMC article.
References
- Blot WJ, Devesa SS, Kneller RW, et al. Rising incidence of adenocarcinoma of the esophagus and gastric cardia. JAMA. 1991;265:1287–9. - PubMed
- Blot WJ, Devesa SS, Fraumeni JF., Jr Continuing climb in rates of esophageal adenocarcinoma: An update. JAMA. 1993;270:1320. - PubMed
- Pera M. Epidemiology of esophageal cancer, especially adenocarcinoma of the esophagus and esophagogastric junction. Recent Results Cancer Res. 2000;155:1–14. - PubMed
- Spechler SJ, Zeroogian JM, Antonioli DA, et al. Prevalence of metaplasia at the gastro-oesophageal junction. Lancet. 1994;344:1533–6. - PubMed
- Farrow DC, Vaughan TL. Determinants of survival following the diagnosis of esophageal adenocarcinoma (United States) Cancer Causes Control. 1996;7:322–7. - PubMed
Publication types
MeSH terms
Substances
LinkOut - more resources
Full Text Sources
Other Literature Sources
