Genome trees constructed using five different approaches suggest new major bacterial clades - PubMed (original) (raw)
Genome trees constructed using five different approaches suggest new major bacterial clades
Y I Wolf et al. BMC Evol Biol. 2001.
Abstract
Background: The availability of multiple complete genome sequences from diverse taxa prompts the development of new phylogenetic approaches, which attempt to incorporate information derived from comparative analysis of complete gene sets or large subsets thereof. Such attempts are particularly relevant because of the major role of horizontal gene transfer and lineage-specific gene loss, at least in the evolution of prokaryotes.
Results: Five largely independent approaches were employed to construct trees for completely sequenced bacterial and archaeal genomes: i) presence-absence of genomes in clusters of orthologous genes; ii) conservation of local gene order (gene pairs) among prokaryotic genomes; iii) parameters of identity distribution for probable orthologs; iv) analysis of concatenated alignments of ribosomal proteins; v) comparison of trees constructed for multiple protein families. All constructed trees support the separation of the two primary prokaryotic domains, bacteria and archaea, as well as some terminal bifurcations within the bacterial and archaeal domains. Beyond these obvious groupings, the trees made with different methods appeared to differ substantially in terms of the relative contributions of phylogenetic relationships and similarities in gene repertoires caused by similar life styles and horizontal gene transfer to the tree topology. The trees based on presence-absence of genomes in orthologous clusters and the trees based on conserved gene pairs appear to be strongly affected by gene loss and horizontal gene transfer. The trees based on identity distributions for orthologs and particularly the tree made of concatenated ribosomal protein sequences seemed to carry a stronger phylogenetic signal. The latter tree supported three potential high-level bacterial clades,: i) Chlamydia-Spirochetes, ii) Thermotogales-Aquificales (bacterial hyperthermophiles), and ii) Actinomycetes-Deinococcales-Cyanobacteria. The latter group also appeared to join the low-GC Gram-positive bacteria at a deeper tree node. These new groupings of bacteria were supported by the analysis of alternative topologies in the concatenated ribosomal protein tree using the Kishino-Hasegawa test and by a census of the topologies of 132 individual groups of orthologous proteins. Additionally, the results of this analysis put into question the sister-group relationship between the two major archaeal groups, Euryarchaeota and Crenarchaeota, and suggest instead that Euryarchaeota might be a paraphyletic group with respect to Crenarchaeota.
Conclusions: We conclude that, the extensive horizontal gene flow and lineage-specific gene loss notwithstanding, extension of phylogenetic analysis to the genome scale has the potential of uncovering deep evolutionary relationships between prokaryotic lineages.
Figures
Figure 1
Distribution of conserved gene pairs among 31 clades of prokaryotes. Closely related genomes: E. coli-Buchnera sp., H. influenzae-P. mutocida, C. trachomatis-C. pneumoniae, P. horikoshii-P. abyssi, M. genitalium-M. pneumoniae-U. urealyticum., H. pyroli – C. jejuni, T. acidophilum-T. volcanium, were treated as a single clade. Nis the total number of conserved gene pairs.
Figure 2
Distribution of identity percentage between probable orthologs in genome pairs. The distributions are for the sets of probable orthologs detected with an e-value cut-off of 0.001. For species name abbreviations, see Materials and Methods.
Figure 3
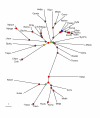
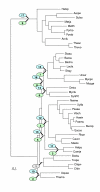
Maximum parsimony tree (Dollo parsimony) based on absence-presence of genomes in orthologous gene sets. The tree is unrooted. The circles indicate the level of bootstrap support, with the following color coding: red: 90–100%, yellow: 80–90%, green: 70–80%, blue: 60–70%, magenta: 40–60%. The nodes with <40% support are unmarked.
Figure 4
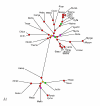
Maximum parsimony tree (Dollo parsimony) of prokaryotes based on presence-absence of gene pairs in genomes. The designations are as in Fig. 3.
Figure 5
Distance tree constructed using the median of the percent identity distribution between probable orthologs for evolutionary distance calculation. An E-value cut-off of 0.001 was used to identify bidirectional best hits between proteins encoded in all pairs of genomes. Distances were calculated using the logarithmic formula. The designations are as in Fig. 3.
Figure 6
Maximum-likelihood tree produced from concatenated alignments of the universal subset of ribosomal proteins. The designations are as in Fig. 3.
Figure 7
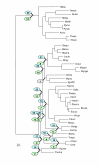
The Kishino-Hasegawa test for the Aquifex-Thermotoga clade. "1" indicates the original position of the tested clade in the concatenated ribosomal proteins tree (Fig. 6). The remaining numbers show the alternative positions tested for each of these species (in green ovals for Aquifex and blue for Thermotoga). For the likelihood values and RELL bootstrap values for each of the corresponding topologies, see Table 3A.
Figure 8
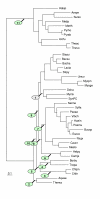
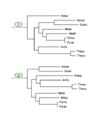
The Kishino-Hasegawa test for the Deinococcus-Mycobacterium-Synechocystis clade. The identical scheme of producing alternative topologies was used for each of the three species. For example for Deinococcus (see Table 4) the green ovals (## 2 to 13) indicate alternative placements of Deinococcus with Mycobacterium and Synechocystis occupying the original position and the blue ovals (## 14 to 25) indicate alternative placements of the Mycobacterium-Synechocystis pair with Deinococcus left in the original position. The same was done with Mycobacterium versus Deinococcus-Synechocystis pair (Table 5) and Synechocystis versus Deinococcus-Mycobacterium pair (Table 6).
Figure 9
The Kishino-Hasegawa test for the unification of the Deinococcus-Mycobacterium-Synechocystis clade with Gram-positive bacteria. See Table 7.
Figure 10
The Kishino-Hasegawa test for the Spirochete-Chlamydia clade. Green ovals: chlamydia, blue ovals: spirochetes. See Table 8.
Figure 11
The Kishino-Hasegawa test for the unification of ε-proteobacteria with the rest of Proteobacteria. See Table 9.
Figure 12
The Kishino-Hasegawa test for position of Crenarchaeota with respect to Euryarchaeota. Position of Crenarchaeota with respect to Euryarchaeota (1) – the maximum-likelihood tree topology; (2) – the competing topology with Crenarchaeota and Euryarchaeota as sister groups. See Table 10
Figure 13
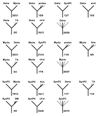
A census of the topologies of maximum-likelihood trees for individual protein families.Thermotoga and Aquifex. In each panel, the left top icon shows the grouping tested and the remaining icons show the most common alternative topologies for the given species/group. Dotted lines indicate optional presence of (possibly several) members of the indicated group (e.g. "proteo" with several dotted lines leading to it means that any number and combination of proteobacterial proteins could be present on the given branch). For each icon, the number of COG trees with the given topology (upper number) and the size of the subset supported by at least 70% bootstrap values (lower number) are indicated. Uncertain topologies (lacking clearly defined taxonomic units on the other side of the subtree or those without bootstrap support) are indicated by multiple dotted lines without indication of the neighbor. Abbreviations: TA – Thema and/or Aquae; DMS – any combination of Deira, Myctu and SynPC. Note that, in some cases, which involve taxonomic clades rather than single organisms (e.g. spirochetes), failure of the corresponding species to form a clade in the given tree may lead to asymmetrical counts of topologies. For example, if a particular tree has a (Deira,(Trepa, Borbu)) branch, this tree will be included in both the Deira-spiro and spiro-Deira tallies. If, however, the subtree ((Deira, Trepa),(Aquae, Borbu)) is present, then the Deira-spiro and Aquae-spiro tallies gain one count each, but the spiro-Deira and spiro-Aquae tallies do not; instead, a case of spirochete polyphyly is registered.
Figure 14
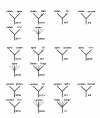
A census of the topologies of maximum-likelihood trees for individual protein families.Deinococcus, Mycobacterium and Synechocystis. The designations are as in Fig. 3.
Figure 15
A census of the topologies of maximum-likelihood trees for individual protein families. Spirochetes, chlamydia and epsilon-protoebacteria. The designations are as in Fig. 3.
Similar articles
- Genome alignment, evolution of prokaryotic genome organization, and prediction of gene function using genomic context.
Wolf YI, Rogozin IB, Kondrashov AS, Koonin EV. Wolf YI, et al. Genome Res. 2001 Mar;11(3):356-72. doi: 10.1101/gr.gr-1619r. Genome Res. 2001. PMID: 11230160 - Algorithms for computing parsimonious evolutionary scenarios for genome evolution, the last universal common ancestor and dominance of horizontal gene transfer in the evolution of prokaryotes.
Mirkin BG, Fenner TI, Galperin MY, Koonin EV. Mirkin BG, et al. BMC Evol Biol. 2003 Jan 6;3:2. doi: 10.1186/1471-2148-3-2. Epub 2003 Jan 6. BMC Evol Biol. 2003. PMID: 12515582 Free PMC article. - Clusters of orthologous genes for 41 archaeal genomes and implications for evolutionary genomics of archaea.
Makarova KS, Sorokin AV, Novichkov PS, Wolf YI, Koonin EV. Makarova KS, et al. Biol Direct. 2007 Nov 27;2:33. doi: 10.1186/1745-6150-2-33. Biol Direct. 2007. PMID: 18042280 Free PMC article. - Genome trees and the nature of genome evolution.
Snel B, Huynen MA, Dutilh BE. Snel B, et al. Annu Rev Microbiol. 2005;59:191-209. doi: 10.1146/annurev.micro.59.030804.121233. Annu Rev Microbiol. 2005. PMID: 16153168 Review. - The Turbulent Network Dynamics of Microbial Evolution and the Statistical Tree of Life.
Koonin EV. Koonin EV. J Mol Evol. 2015 Jun;80(5-6):244-50. doi: 10.1007/s00239-015-9679-7. Epub 2015 Apr 18. J Mol Evol. 2015. PMID: 25894542 Free PMC article. Review.
Cited by
- Evolutionary sequence analysis of complete eukaryote genomes.
Blair JE, Shah P, Hedges SB. Blair JE, et al. BMC Bioinformatics. 2005 Mar 11;6:53. doi: 10.1186/1471-2105-6-53. BMC Bioinformatics. 2005. PMID: 15762985 Free PMC article. - Quantitative exploration of the occurrence of lateral gene transfer by using nitrogen fixation genes as a case study.
Kechris KJ, Lin JC, Bickel PJ, Glazer AN. Kechris KJ, et al. Proc Natl Acad Sci U S A. 2006 Jun 20;103(25):9584-9. doi: 10.1073/pnas.0603534103. Epub 2006 Jun 12. Proc Natl Acad Sci U S A. 2006. PMID: 16769896 Free PMC article. - CVTree: a phylogenetic tree reconstruction tool based on whole genomes.
Qi J, Luo H, Hao B. Qi J, et al. Nucleic Acids Res. 2004 Jul 1;32(Web Server issue):W45-7. doi: 10.1093/nar/gkh362. Nucleic Acids Res. 2004. PMID: 15215347 Free PMC article. - Digital DNA-DNA hybridization for microbial species delineation by means of genome-to-genome sequence comparison.
Auch AF, von Jan M, Klenk HP, Göker M. Auch AF, et al. Stand Genomic Sci. 2010 Jan 28;2(1):117-34. doi: 10.4056/sigs.531120. Stand Genomic Sci. 2010. PMID: 21304684 Free PMC article. - Evolutionarily conserved orthologous families in phages are relatively rare in their prokaryotic hosts.
Kristensen DM, Cai X, Mushegian A. Kristensen DM, et al. J Bacteriol. 2011 Apr;193(8):1806-14. doi: 10.1128/JB.01311-10. Epub 2011 Feb 11. J Bacteriol. 2011. PMID: 21317336 Free PMC article.
References
- Doolittle RF, Feng DF, Tsang S, Cho G, Little E. Determining divergence times of the major kingdoms of living organisms with a protein clock. Science. 1996;271:470–477. - PubMed
- Teichmann SA, Mitchison G. Is there a phylogenetic signal in prokaryote proteins? J Mol Evol. 1999;49:98–107. - PubMed
MeSH terms
Substances
LinkOut - more resources
Full Text Sources
Other Literature Sources
Miscellaneous


