Actin filaments and myosin I alpha cooperate with microtubules for the movement of lysosomes - PubMed (original) (raw)
Actin filaments and myosin I alpha cooperate with microtubules for the movement of lysosomes
M N Cordonnier et al. Mol Biol Cell. 2001 Dec.
Free PMC article
Abstract
An earlier report suggested that actin and myosin I alpha (MMIalpha), a myosin associated with endosomes and lysosomes, were involved in the delivery of internalized molecules to lysosomes. To determine whether actin and MMIalpha were involved in the movement of lysosomes, we analyzed by time-lapse video microscopy the dynamic of lysosomes in living mouse hepatoma cells (BWTG3 cells), producing green fluorescent protein actin or a nonfunctional domain of MMIalpha. In GFP-actin cells, lysosomes displayed a combination of rapid long-range directional movements dependent on microtubules, short random movements, and pauses, sometimes on actin filaments. We showed that the inhibition of the dynamics of actin filaments by cytochalasin D increased pauses of lysosomes on actin structures, while depolymerization of actin filaments using latrunculin A increased the mobility of lysosomes but impaired the directionality of their long-range movements. The production of a nonfunctional domain of MMIalpha impaired the intracellular distribution of lysosomes and the directionality of their long-range movements. Altogether, our observations indicate for the first time that both actin filaments and MMIalpha contribute to the movement of lysosomes in cooperation with microtubules and their associated molecular motors.
Figures
Figure 1
Subcellular distribution of BODIPY-TR pepstatin A in BWTG3 cells. After internalization for 90 min of BODIPY-TR pepstatin A and a 20-min chase at 37°C, fixed and permeabilized cells were labeled with anti-Lamp1 (B), or anti-transferrin receptor (D) antibodies. (A, B) Distribution of BODIPY-TR pepstatin A and Lamp1 respectively on a confocal section near the cell base. (C, D) Distribution of BODIPY-TR pepstatin A and transferrin receptor respectively on a confocal section near the cell base. Bar = 10 μm. Inserts show higher magnification
Figure 2
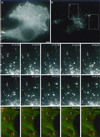
Analysis of BODIPY-TR pepstatin A-filled compartment movements in a cell producing GFP-actin by time-lapse video microscopy. Thirty-one couples of GFP/Texas Red images were captured at a rate of one couple every 6 s, for a cell producing GFP-actin after BODIPY-TR pepstatin A internalization. (A) First GFP-actin frame of the time-lapse sequence. (B) First BODIPY-TR pepstatin A frame of the time-lapse sequence. (C) BODIPY-TR pepstatin A time-lapse sequence in a part of the cell shown in panels A and B at a rate of one image every 12 s (the exact time is given on the pictures), showing different types of movements. Particle number 1 exhibits a combination of short random and rapid directional movements, particle number 2 transiently elongates and performs short random movements, and particle number 3 undergoes a rapid long-range directional movement. (D) BODIPY-TR pepstatin A (red) and GFP-actin (green) time-lapse sequencein a part of the cell shown in panels A and B, at a rate of 1 image every 12 s, showing one BODIPY-TR pepstatin A-filled compartment going toward an actin cable and stopping there (particle number 4), another one stopping on an actin cable and escaping (particle number 5), and a region rich in F-actin containing several immobile BODIPY-TR pepstatin A- filled compartments, including particle number 6. (E) Examples of trajectories of BODIPY-TR pepstatin A-filled compartments in the cell shown in A and B (colored lines and dots). For clarity, a set of colors and dot shapes was assigned to each particle; a bigger dot shows the beginning of each track. The outlines of the cell and its nucleus were represented (continuous lines) from a phase contrast image taken at the beginning of the time-lapse sequence. Numbers in the black rectangles point out the corresponding particles followed in (C) and (D). Numbers 7 and 8 show examples of trajectories of oscillating lysosomes, numbers 9, 10, 11, and 12 show examples of centripetal and centrifugal trajectories respectively. (F) Examples of mean square displacements (dots with error bars) and corresponding fits (continuous lines) with Equation (2) for a lysosome undergoing diffusive motion (number 8), and a lysosome undergoing diffusive and directed motion (number 7). The mean square displacement of a confined lysosome is also shown (number 6). It cannot be fitted with equation (2). Dashed lines are straight lines to emphasize the curvature of the mean square displacement of particles 6 (blue) and 7 (green). For clarity, mean square displacement of particles 7 and 8 were divided by 10 before plotting. Bar = 5 μm.
Figure 3
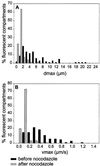
Analysis of the distribution of maximal displacements and maximum speeds recorded for BODIPY-TR pepstatin A-filled compartments of a cell producing GFP-actin, before and after addition of nocodazole. (A) and (B) show respectively the distribution of maximal displacements dmax for a period of time of 3 min and the distribution of maximum speeds vmax, before (black bars) and after (gray bars) nocodazole treatment. 104 and 154 fluorescent particles were tracked before and after drug treatment, respectively. The number of fluorescent particles with a given dmax or vmax is calculated as a percentage of the total number of fluorescent particles analyzed.
Figure 4
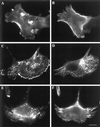
Drugs that disorganize actin filaments do not affect microtubules organization. BWTG3 cells were labeled with fluorescent phalloidin (A, C, E) and antitubulin antibody (B, D, F) without treatment (A, B), after 15 min incubation at 37°C with 1 μM cytochalasin D (C, D), or 10 min incubation at 37° with 0,5 μM latrunculin A (E, F). Bar = 10 μm.
Figure 5
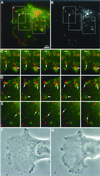
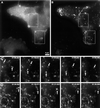
Cytochalasin D treatment immobilizes BODIPY-TR pepstatin A-filled compartments in actin patches in a cell producing GFP-actin. (A) and (B) first frames of time-lapse sequences presented in (C), (D), and (E) after 10 min of cytochalasin D treatment. (A) shows the merge GFP-actin and BODIPY-TR pepstatin A images and (B) BODIPY-TR the pepstatin A image. (C) BODIPY-TR pepstatin A (red) and GFP-actin (green) time-lapse sequence in the perinuclear region of the cell shown in A and B. (D) BODIPY-TR pepstatin A (red) and GFP-actin (green) time-lapse sequence in peripheral region of the cell shown in A and B. Arrows point out fluorescent compartments (red) trapped in actin patches (green). (E) example of fluorescent compartments not trapped in actin patches. Arrows point out one of them that exhibits large random movements. To emphasize the immobility of pepstatin A-filled compartments and actin patches, only one image, approximately every 24 s, was presented from the time-lapse sequences. (F) phase contrast image of the cell before cytochalasin D treatment. (G) phase contrast image of the cell after cytochalasin D treatment, just at the beginning of the time-lapse sequence shown in (C), (D), and (E). Bar = 5 μm.
Figure 6
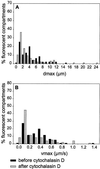
Analysis of the distribution of maximal displacements and maximum speeds recorded for BODIPY-TR pepstatin A filled compartments of a cell producing GFP-actin, before and after addition of cytochalasin D. (A) and (B) show, respectively, the distribution of maximal displacements dmax within 3 min and the distribution of maximum speeds vmax, before (black bars) and after (gray bars) cytochalasin D treatment. Ninety-five and 96 fluorescent particles were tracked before and after drug treatment, respectively. The number of fluorescent particles with a given dmax or vmax was calculated as a percentage of the total number of fluorescent particles analyzed.
Figure 7
Latrunculin A treatment induces rapid BODIPY-TR pepstatin A filled compartment movements with a loss of directionality in a cell producing GFP-actin. (A) and (B), respectively, show GFP-actin and BODIPY-TR pepstatin A images corresponding to the first frame of the BODIPY-TR pepstatin A time-lapse sequences presented in (C) and (D), 5 min after latrunculin A addition. (C): Time-lapse sequence (one image every 12 s) showing two dynamic elongated BODIPY-TR pepstatin A-filled compartments with no real directionality in the perinuclear region (arrows). (D):Time-lapse sequence (one image every 12 s) showing a peripheral region where BODIPY-TR pepstatin A-filled compartments are so dynamic that they can't be followed individually (circle), and a BODIPY-TR pepstatin A-filled compartment changing shape very quickly (arrow). Bar = 5 μm.
Figure 8
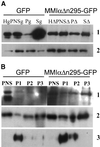
Detection of MMIα or GFP-MM ΙαΔn295 in the subcellular fraction of BWTG3 cells producing GFP or GFP-MM ΙαΔn295. (A) Postnuclear supernatants of both cell lines were centrifuged 30 min at 300,000 × g, and pellets and supernatants were collected. Ten micrograms homogenate (Hg, HΔ), PNS (PNSg, PNSΔ), protein from the pellet equivalent to 10 μg PNS (Pg, PΔ), and protein from the supernatant equivalent to 100 micrograms of PNS (Sg, SΔ) were separated by 7.5% SDS-PAGE and transferred onto nitrocellulose membranes. The membranes were probed with anti-GFP (lane 1) and anti-MMIα antibodies (lane 2). (B) Fractions collected after separation by Percoll density gradient of the PNS from both cell lines were combined together into three pools, separating lysosomes from endosomes and plasma membranes, as already described for wild-type cells (Raposo et al., 1999). The same amount of protein of each pool (P1, P2, P3) was loaded on 7.5% SDS-PAGE, together with the same amount of protein of the related PNS (PNS) and were analyzed by immunoblotting with anti-GFP (lane 1), anti-MMIα (lane 2), and anti-Lamp1 antibodies (lane 3). The fraction shown in P1 is enriched for the lysosomal marker and exhibits also the endogenous MMIα and GFP-MM ΙαΔn295.
Figure 9
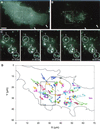
Analysis of the movement of BODIPY-TR pepstatin A filled compartments in cells producing GFP-MM ΙαΔn295 by time-lapse video microscopy. Thirty-one couples of GFP/Texas Red images were captured at a rate of one couple every 6 s for a cell producing GFP-MM ΙαΔn295 after BODIPY-TR pepstatin A internalization. (A) First GFP-MM ΙαΔn295 of the time-lapse sequence. (B): First BODIPY-TR pepstatin A frame of the time-lapse sequence. The white arrows in B indicate the cell periphery, empty of lysosomes. (C) Pepstatin A time-lapse sequence in the rectangle area shown in panels A and B at a rate of one image every 12s (the exact time is given on the pictures), showing that vesicle movements are limited or perturbed by neighboring vesicles. The circles 1, 2, 3 show regions where lysosomes seem to be influenced by each other. (D) Examples of trajectories of pepstatin A-filled compartments in the cell shown in A and B, tracked under the same conditions as for Figure 2. Bar = 10 μm.
Figure 10
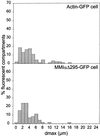
Analysis of the distribution of maximal displacements recorded for BODIPY-TR pepstatin A-filled compartments of cells producing GFP-actin and GFP-MM ΙαΔn295. The cells analyzed here are the two cells described in Figure 2, and 9. Ninety-one and 71 fluorescent particles, respectively, were tracked in the cells producing GFP-actin and GFP-MM ΙαΔn295 respectively. The number of fluorescent particles with a given dmax within 3 min is calculated as a percentage of the total number of fluorescent particles analyzed. Twice more BODIPY-TR pepstatin A filled compartments have a dmax higher than 6.5 μm in actin-GFP cells than in GFP-MM ΙαΔn295.
Figure 11
Effect of nocodazole on movements of a BODIPY-TR pepstatin A compartments in GFP-actin and GFP-MM ΙαΔn295 expressing cells. A and B show examples of trajectories tracked on time-lapse sequences showing the dynamic of BODIPY-TR pepstatin A compartments in cells producing GFP-actin in the absence (A) or after the addition (B) of nocodazole. C and D show examples of trajectories tracked on the time-lapse sequences showing the dynamic of BODIPY-TR pepstatin A compartments in cells producing GFP-MM ΙαΔn295 in the absence (C) or after the addition (D) of nocodazole. Note that trajectories are distributed throughout the cytoplasm in the control cell while they are concentrated next to the nucleus in the cell producing GFP-MM ΙαΔn295.
Figure 12
The production of GFP-MM ΙαΔn295 doesn't affect actin network and microtubule cellular distribution. Cells producing GFP-MM ΙαΔn295 (A, C, E, and G) or mock cells (B, D, F, and H) were labeled with fluorescent phalloidin (E, F) or anti tubulin antibody (G, H). A, B, C, and D show the cellular distribution of GFP-MM ΙαΔn295 and GFP, respectively. Bars = 10 μm.
Similar articles
- Migration of Nucleocapsids in Vesicular Stomatitis Virus-Infected Cells Is Dependent on both Microtubules and Actin Filaments.
Yacovone SK, Smelser AM, Macosko JC, Holzwarth G, Ornelles DA, Lyles DS. Yacovone SK, et al. J Virol. 2016 Jun 10;90(13):6159-70. doi: 10.1128/JVI.00488-16. Print 2016 Jul 1. J Virol. 2016. PMID: 27122580 Free PMC article. - Role of microtubules and actin filaments in the movement of mitochondria in the axons and dendrites of cultured hippocampal neurons.
Ligon LA, Steward O. Ligon LA, et al. J Comp Neurol. 2000 Nov 20;427(3):351-61. doi: 10.1002/1096-9861(20001120)427:3<351::aid-cne3>3.0.co;2-r. J Comp Neurol. 2000. PMID: 11054698 - Vesicle transport: the role of actin filaments and myosin motors.
DePina AS, Langford GM. DePina AS, et al. Microsc Res Tech. 1999 Oct 15;47(2):93-106. doi: 10.1002/(SICI)1097-0029(19991015)47:2<93::AID-JEMT2>3.0.CO;2-P. Microsc Res Tech. 1999. PMID: 10523788 Review. - mRNA and cytoskeletal filaments.
Bassell G, Singer RH. Bassell G, et al. Curr Opin Cell Biol. 1997 Feb;9(1):109-15. doi: 10.1016/s0955-0674(97)80159-7. Curr Opin Cell Biol. 1997. PMID: 9013679 Review.
Cited by
- Involvement of lysosomal exocytosis in the excretion of mesoporous silica nanoparticles and enhancement of the drug delivery effect by exocytosis inhibition.
Yanes RE, Tarn D, Hwang AA, Ferris DP, Sherman SP, Thomas CR, Lu J, Pyle AD, Zink JI, Tamanoi F. Yanes RE, et al. Small. 2013 Mar 11;9(5):697-704. doi: 10.1002/smll.201201811. Epub 2012 Nov 14. Small. 2013. PMID: 23152124 Free PMC article. - Rab11 and actin cytoskeleton participate in Giardia lamblia encystation, guiding the specific vesicles to the cyst wall.
Castillo-Romero A, Leon-Avila G, Wang CC, Perez Rangel A, Camacho Nuez M, Garcia Tovar C, Ayala-Sumuano JT, Luna-Arias JP, Hernandez JM. Castillo-Romero A, et al. PLoS Negl Trop Dis. 2010 Jun 1;4(6):e697. doi: 10.1371/journal.pntd.0000697. PLoS Negl Trop Dis. 2010. PMID: 20532229 Free PMC article. - Mammalian late vacuole protein sorting orthologues participate in early endosomal fusion and interact with the cytoskeleton.
Richardson SC, Winistorfer SC, Poupon V, Luzio JP, Piper RC. Richardson SC, et al. Mol Biol Cell. 2004 Mar;15(3):1197-210. doi: 10.1091/mbc.e03-06-0358. Epub 2003 Dec 10. Mol Biol Cell. 2004. PMID: 14668490 Free PMC article. - Myosin-1C augments endothelial secretion of von Willebrand factor by linking contractile actomyosin machinery to the plasma membrane.
El-Mansi S, Mitchell TP, Mobayen G, McKinnon TAJ, Miklavc P, Frick M, Nightingale TD. El-Mansi S, et al. Blood Adv. 2024 Sep 10;8(17):4714-4726. doi: 10.1182/bloodadvances.2024012590. Blood Adv. 2024. PMID: 38669344 Free PMC article.
References
- Andrews N. Regulated secretion of conventional lysosomes. Trends Cell Biol. 2000;10:316–321. - PubMed
- Ballestrem B, Wehrle-Haller B, Imhof BA. Actin dynamics in living mammalian cells. J Cell Sci. 1998;111:1649–1658. - PubMed
Publication types
MeSH terms
Substances
LinkOut - more resources
Full Text Sources
Molecular Biology Databases

