Evidence for a language quantitative trait locus on chromosome 7q in multiplex autism families - PubMed (original) (raw)
Evidence for a language quantitative trait locus on chromosome 7q in multiplex autism families
Maricela Alarcón et al. Am J Hum Genet. 2002 Jan.
Abstract
Autism is a syndrome characterized by deficits in language and social skills and by repetitive behaviors. We hypothesized that potential quantitative trait loci (QTLs) related to component autism endophenotypes might underlie putative or significant regions of autism linkage. We performed nonparametric multipoint linkage analyses, in 152 families from the Autism Genetic Resource Exchange, focusing on three traits derived from the Autism Diagnostic Interview: "age at first word," "age at first phrase," and a composite measure of "repetitive and stereotyped behavior." Families were genotyped for 335 markers, and multipoint sib pair linkage analyses were conducted. Using nonparametric multipoint linkage analysis, we found the strongest QTL evidence for age at first word on chromosome 7q (nonparametric test statistic [Z] 2.98; P=.001), and subsequent linkage analyses of additional markers and association analyses in the same region supported the initial result (Z=2.85, P=.002; chi(2)=18.84, df 8, P=.016). Moreover, the peak fine-mapping result for repetitive behavior (Z=2.48; P=.007) localized to a region overlapping this language QTL. The putative autism-susceptibility locus on chromosome 7 may be the result of separate QTLs for the language and repetitive or stereotyped behavior deficits that are associated with the disorder.
Figures
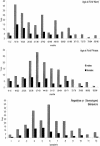
Figure 1
Distributions of autism endophenotypes for each sex
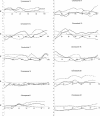
Figure 2
Nonparametric QTL results of an autosomal genome scan for age at first word (solid line), age at first phrase (dotted line), and the composite measure of repetitive and stereotyped behavior (dashed line). Left, Chromosomes 1–12. Right, Chromosomes 13–22.
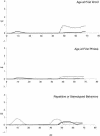
Figure 3
Nonparametric X-linkage results for WORD, PHRASE, and RSB for brother-brother (bold line), brother-sister (solid line), and sister-sister (dotted line) pairs.
Figure 4
Plots of nonparametric Z scores (calculated at 5-cM intervals) for WORD (solid line), PHRASE (dotted line), and RSB (dashed line) on chromosome 7. Previous loci identified for language deficits or autism are also included in the figure: the rectangle with diagonal stripes represents the region identified in a family with severe speech disorder (Fisher et al. 1998); the rectangle with cross-hatches represents the autism region reported in the initial IMGSAC (1998) study; and the arrow indicates the peak linkage result from an update of the IMGSAC study (IMGSAC 2001).
Figure 5
Plots of nonparametric Z scores for linkage analysis of 28 additional markers flanking the chromosome 7q region identified in the quantitative genome scan. Results for WORD (solid line), PHRASE (dotted line), and RSB (dashed line) are shown. The 10 markers included in the association analysis are listed in the figure. The rectangle with diagonal stripes represents the region identified in a family with severe speech disorder (Fisher et al. 1998); the rectangle with cross-hatches represents the autism region reported in the IMGSAC (1998) study; and the rectangle with dots represents the results of a linkage analysis using the narrow diagnosis of autism (Liu et al. 2001). The X-axis tick marks are at 2-cM intervals.
Figure 6 (Online Only)
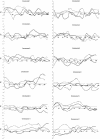
Information-content plots for the genome for 152 nuclear families from AGRE. On average, markers are spaced every 10 cM.
Figure 6 (Online Only)
Information-content plots for the genome for 152 nuclear families from AGRE. On average, markers are spaced every 10 cM.
Figure 6 (Online Only)
Information-content plots for the genome for 152 nuclear families from AGRE. On average, markers are spaced every 10 cM.
Figure 6 (Online Only)
Information-content plots for the genome for 152 nuclear families from AGRE. On average, markers are spaced every 10 cM.
Figure 6 (Online Only)
Information-content plots for the genome for 152 nuclear families from AGRE. On average, markers are spaced every 10 cM.
Figure 6 (Online Only)
Information-content plots for the genome for 152 nuclear families from AGRE. On average, markers are spaced every 10 cM.
Figure 6 (Online Only)
Information-content plots for the genome for 152 nuclear families from AGRE. On average, markers are spaced every 10 cM.
Figure 6 (Online Only)
Information-content plots for the genome for 152 nuclear families from AGRE. On average, markers are spaced every 10 cM.
Figure 6 (Online Only)
Information-content plots for the genome for 152 nuclear families from AGRE. On average, markers are spaced every 10 cM.
Figure 6 (Online Only)
Information-content plots for the genome for 152 nuclear families from AGRE. On average, markers are spaced every 10 cM.
Figure 6 (Online Only)
Information-content plots for the genome for 152 nuclear families from AGRE. On average, markers are spaced every 10 cM.
Figure 6 (Online Only)
Information-content plots for the genome for 152 nuclear families from AGRE. On average, markers are spaced every 10 cM.
Figure 6 (Online Only)
Information-content plots for the genome for 152 nuclear families from AGRE. On average, markers are spaced every 10 cM.
Figure 6 (Online Only)
Information-content plots for the genome for 152 nuclear families from AGRE. On average, markers are spaced every 10 cM.
Figure 6 (Online Only)
Information-content plots for the genome for 152 nuclear families from AGRE. On average, markers are spaced every 10 cM.
Figure 6 (Online Only)
Information-content plots for the genome for 152 nuclear families from AGRE. On average, markers are spaced every 10 cM.
Figure 6 (Online Only)
Information-content plots for the genome for 152 nuclear families from AGRE. On average, markers are spaced every 10 cM.
Figure 6 (Online Only)
Information-content plots for the genome for 152 nuclear families from AGRE. On average, markers are spaced every 10 cM.
Figure 6 (Online Only)
Information-content plots for the genome for 152 nuclear families from AGRE. On average, markers are spaced every 10 cM.
Figure 6 (Online Only)
Information-content plots for the genome for 152 nuclear families from AGRE. On average, markers are spaced every 10 cM.
Figure 6 (Online Only)
Information-content plots for the genome for 152 nuclear families from AGRE. On average, markers are spaced every 10 cM.
Figure 6 (Online Only)
Information-content plots for the genome for 152 nuclear families from AGRE. On average, markers are spaced every 10 cM.
Figure 6 (Online Only)
Information-content plots for the genome for 152 nuclear families from AGRE. On average, markers are spaced every 10 cM.
Similar articles
- Quantitative genome scan and Ordered-Subsets Analysis of autism endophenotypes support language QTLs.
Alarcón M, Yonan AL, Gilliam TC, Cantor RM, Geschwind DH. Alarcón M, et al. Mol Psychiatry. 2005 Aug;10(8):747-57. doi: 10.1038/sj.mp.4001666. Mol Psychiatry. 2005. PMID: 15824743 - Genome-wide and Ordered-Subset linkage analyses provide support for autism loci on 17q and 19p with evidence of phenotypic and interlocus genetic correlates.
McCauley JL, Li C, Jiang L, Olson LM, Crockett G, Gainer K, Folstein SE, Haines JL, Sutcliffe JS. McCauley JL, et al. BMC Med Genet. 2005 Jan 12;6:1. doi: 10.1186/1471-2350-6-1. BMC Med Genet. 2005. PMID: 15647115 Free PMC article. - A quantitative trait locus analysis of social responsiveness in multiplex autism families.
Duvall JA, Lu A, Cantor RM, Todd RD, Constantino JN, Geschwind DH. Duvall JA, et al. Am J Psychiatry. 2007 Apr;164(4):656-62. doi: 10.1176/ajp.2007.164.4.656. Am J Psychiatry. 2007. PMID: 17403980 - The molecular genetics of autism.
Wassink TH, Piven J. Wassink TH, et al. Curr Psychiatry Rep. 2000 Apr;2(2):170-5. doi: 10.1007/s11920-000-0063-x. Curr Psychiatry Rep. 2000. PMID: 11122951 Review. - The genetics of autism.
Muhle R, Trentacoste SV, Rapin I. Muhle R, et al. Pediatrics. 2004 May;113(5):e472-86. doi: 10.1542/peds.113.5.e472. Pediatrics. 2004. PMID: 15121991 Review.
Cited by
- A Novel Stratification Method in Linkage Studies to Address Inter- and Intra-Family Heterogeneity in Autism.
Talebizadeh Z, Arking DE, Hu VW. Talebizadeh Z, et al. PLoS One. 2013 Jun 26;8(6):e67569. doi: 10.1371/journal.pone.0067569. Print 2013. PLoS One. 2013. PMID: 23840741 Free PMC article. - Stratification based on language-related endophenotypes in autism: attempt to replicate reported linkage.
Spence SJ, Cantor RM, Chung L, Kim S, Geschwind DH, Alarcón M. Spence SJ, et al. Am J Med Genet B Neuropsychiatr Genet. 2006 Sep 5;141B(6):591-8. doi: 10.1002/ajmg.b.30329. Am J Med Genet B Neuropsychiatr Genet. 2006. PMID: 16752361 Free PMC article. - The relationship between restrictive and repetitive behaviors in individuals with autism and obsessive compulsive symptoms in parents.
Abramson RK, Ravan SA, Wright HH, Wieduwilt K, Wolpert CM, Donnelly SA, Pericak-Vance MA, Cuccaro ML. Abramson RK, et al. Child Psychiatry Hum Dev. 2005 Winter;36(2):155-65. doi: 10.1007/s10578-005-2973-7. Child Psychiatry Hum Dev. 2005. PMID: 16228144 - [Genetic and brain structure anomalies in autism spectrum disorders. Towards an understanding of the aetiopathogenesis?].
Nickl-Jockschat T, Michel TM. Nickl-Jockschat T, et al. Nervenarzt. 2011 May;82(5):618-27. doi: 10.1007/s00115-010-2989-5. Nervenarzt. 2011. PMID: 20407737 Review. German. - Autism risk assessment in siblings of affected children using sex-specific genetic scores.
Carayol J, Schellenberg GD, Dombroski B, Genin E, Rousseau F, Dawson G. Carayol J, et al. Mol Autism. 2011 Oct 21;2(1):17. doi: 10.1186/2040-2392-2-17. Mol Autism. 2011. PMID: 22017886 Free PMC article.
References
Electronic-Database Information
- AGRE, http://agre.org/
- Center for Medical Genetics, Marshfield Medical Research Foundation, http://research.marshfieldclinic.org/genetics/
- Genome Database, The, http://gdbwww.gdb.org/
- Online Mendelian Inheritance in Man (OMIM), http://www.ncbi.nlm.nih.gov/Omim/ (for autism disorder [MIM accession number <209850>])
References
- Aita VM, Christiano AM, Gilliam TC (1999) Mapping complex traits in diseases of the hair and skin. Exp Dermatol 8:439–452 - PubMed
- Alarcón M, Cantor RM (2001) QTL mapping of serum IgE in an isolated Hutterite population. Genet Epidemiol 21:S224–S229 - PubMed
- Anderson MA, Gusella JF (1984) Use of cyclosporin A in establishing Epstein-Barr virus–transformed human lymphoblastoid cell lines. In Vitro 20:856–858 - PubMed
- Ashley-Koch A, Wolpert CM, Menold MM, Zaeem L, Basu S, Donnelly SL, Ravan SA, Powell CM, Qumsiyeh MB, Aylsworth AS, Vance JM, Gilbert JR, Wright HH, Abramson RK, DeLong GR, Cuccaro ML, Pericak-Vance MA (1999) Genetic studies of autistic disorder and chromosome 7. Genomics 61:227–236 - PubMed
- Bailey A, Le Couteur A, Gottesman I, Bolton P, Simonoff E, Yuzda E, Rutter M (1995) Autism as a strongly genetic disorder: evidence from a British twin study. Psychol Med 25:63–77 - PubMed
Publication types
MeSH terms
LinkOut - more resources
Full Text Sources
Other Literature Sources
Molecular Biology Databases
Miscellaneous


