Cryptococcus neoformans interactions with amoebae suggest an explanation for its virulence and intracellular pathogenic strategy in macrophages - PubMed (original) (raw)
Cryptococcus neoformans interactions with amoebae suggest an explanation for its virulence and intracellular pathogenic strategy in macrophages
J N Steenbergen et al. Proc Natl Acad Sci U S A. 2001.
Abstract
Cryptococcus neoformans (Cn) is a soil fungus that causes life-threatening meningitis in immunocompromised patients and is a facultative intracellular pathogen capable of replication inside macrophages. The mechanism by which environmental fungi acquire and maintain virulence for mammalian hosts is unknown. We hypothesized that the survival strategies for Cn after ingestion by macrophages and amoebae were similar. Microscopy, fungal and amoebae killing assays, and phagocytosis assays revealed that Cn is phagocytosed by and replicates in Acanthamoeba castellanii, which leads to death of amoebae. An acapsular strain of Cn did not survive when incubated with amoebae, but melanization protected these cells against killing by amoebae. A phospholipase mutant had a decreased replication rate in amoebae compared with isogenic strains. These observations suggest that cryptococcal characteristics that contribute to mammalian virulence also promote fungal survival in amoebae. Intracellular replication was accompanied by the accumulation of polysaccharide containing vesicles similar to those described in Cn-infected macrophages. The results suggest that the virulence of Cn for mammalian cells is a consequence of adaptations that have evolved for protection against environmental predators such as amoebae and provide an explanation for the broad host range of this pathogenic fungus.
Figures
Figure 1
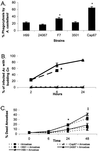
Properties of the infection of Ac by Cn. (A) Phagocytic index for five Cn strains incubated with Ac in PYG media. Error bars denote 1 SD. For each experiment, 100 Ac cells were counted in eight separate wells, and the number of measurements was eight. Similar results were obtained from an additional independent experiment. * indicates P < 0.001 for both Cap67 and F7 when compared with H99, 24067, or 3501. (B) Percent of infected amoebae with budding Cn cells. Error bars denote 1 SD. * denotes the absence of intact amoebae after this time. (C) Percent of Ac cells that do not exclude trypan blue after incubation with different strains of_Cn_. Error bars denote 1 SD. Similar results were obtained from an additional independent experiment. * indicates_P_ = 0.001 when 3501 and H99 were compared with amoeba alone at 24 h. ‡ indicates P < 0.001 at 48 h when 3501 and H99 were compared with amoebae alone.
Figure 2
Microscopy of Ac incubated with Cn in PYG media. Each field is representative of amoeba/Cn interactions at a given time. For both SEM figures, Cn cells are depicted in red and Ac cells are depicted in yellow: (A) SEM 30-min postincubation with_Cn_ 24067 and (B) SEM 90-min postincubation with Cn 24067. (C) TEM 24-h postincubation with Cn 3501. (D) TEM 1.5-h postincubation with Cn 24067. (E and F) Corresponding light microscopy (E) and immunofluorescent (F) pictures 2 h postincubation of Ac with FITC-labeled Cn 3501. (Magnifications: ×1,000.)
Figure 3
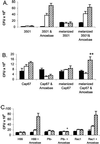
cfu counts of wild-type and mutant Cn strains after incubation with or without Ac in PBS. Bars represent average cfu at different times. Solid bars denote 0 h, white bars denote 24 h, and cross-hatched bars denote 48 h. (A and B) cfu counts of melanized and nonmelanized Cn cells incubated with or without_Ac_ in PBS. (A) Strain 3501 cells. (B) Strain Cap67 cells; ** denotes melanized Cap67 with amoebae has greater growth than Cap67 with amoebae (P < 0.001). (C) Comparison of the cfu counts of Cn between the parental strain, H99, the phospholipase-deficient strain, plb−, and the reconstituted mutant, rec1, strains after incubation with or without Ac in PBS. + indicates a P < 0.001 for plb− with amoebae versus H99 with amoebae. There is no significant difference between H99 and amoebae versus rec1 with amoebae. Error bars denote 1 SD. For each experiment, the number of repetitions was five, and similar results were obtained from two additional independent experiments.
Figure 4
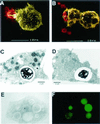
Microscopy of Ac cells infected by Cn. Results are indicative of the cellular disruption induced by_Cn_ infection. (A and B) Corresponding bright-field (A) and immunofluorescent (B) microscopy photos. GXM-specific antibody, 2H1, was used for immunofluorescent staining. (C) TEM photograph showing the disruption of the amoebae phagocytic vacuole membrane (delta signs) and of small vacuole formation (arrows). (D) Immunogold-labeled TEM with 2H1 mAb. Small arrows show internal amoebae vacuoles containing Cn polysaccharide; * depicts the fungal capsule. (Magnifications:A and B, ×1,000; C and D, ×22,500.)
Comment in
- Does amoeboid reasoning explain the evolution and maintenance of virulence factors in Cryptococcus neoformans?
Levitz SM. Levitz SM. Proc Natl Acad Sci U S A. 2001 Dec 18;98(26):14760-2. doi: 10.1073/pnas.261612398. Proc Natl Acad Sci U S A. 2001. PMID: 11752420 Free PMC article. No abstract available.
Similar articles
- Divalent Metal Cations Potentiate the Predatory Capacity of Amoeba for Cryptococcus neoformans.
Fu MS, Casadevall A. Fu MS, et al. Appl Environ Microbiol. 2018 Jan 17;84(3):e01717-17. doi: 10.1128/AEM.01717-17. Print 2018 Feb 1. Appl Environ Microbiol. 2018. PMID: 29150507 Free PMC article. - Amoeba Predation of Cryptococcus neoformans Results in Pleiotropic Changes to Traits Associated with Virulence.
Fu MS, Liporagi-Lopes LC, Dos Santos SR Júnior, Tenor JL, Perfect JR, Cuomo CA, Casadevall A. Fu MS, et al. mBio. 2021 Apr 27;12(2):e00567-21. doi: 10.1128/mBio.00567-21. mBio. 2021. PMID: 33906924 Free PMC article. - Phagosome extrusion and host-cell survival after Cryptococcus neoformans phagocytosis by macrophages.
Alvarez M, Casadevall A. Alvarez M, et al. Curr Biol. 2006 Nov 7;16(21):2161-5. doi: 10.1016/j.cub.2006.09.061. Curr Biol. 2006. PMID: 17084702 - Intracellular parasitism of macrophages by Cryptococcus neoformans.
Feldmesser M, Tucker S, Casadevall A. Feldmesser M, et al. Trends Microbiol. 2001 Jun;9(6):273-8. doi: 10.1016/s0966-842x(01)02035-2. Trends Microbiol. 2001. PMID: 11390242 Review. - The origin and maintenance of virulence for the human pathogenic fungus Cryptococcus neoformans.
Steenbergen JN, Casadevall A. Steenbergen JN, et al. Microbes Infect. 2003 Jun;5(7):667-75. doi: 10.1016/s1286-4579(03)00092-3. Microbes Infect. 2003. PMID: 12787743 Review.
Cited by
- Antifungal efficacy during Candida krusei infection in non-conventional models correlates with the yeast in vitro susceptibility profile.
Scorzoni L, de Lucas MP, Mesa-Arango AC, Fusco-Almeida AM, Lozano E, Cuenca-Estrella M, Mendes-Giannini MJ, Zaragoza O. Scorzoni L, et al. PLoS One. 2013;8(3):e60047. doi: 10.1371/journal.pone.0060047. Epub 2013 Mar 28. PLoS One. 2013. PMID: 23555877 Free PMC article. - Cryptococcosis in kidney transplant recipients: Current understanding and practices.
Meena P, Bhargava V, Singh K, Sethi J, Prabhakar A, Panda S. Meena P, et al. World J Nephrol. 2023 Dec 25;12(5):120-131. doi: 10.5527/wjn.v12.i5.120. World J Nephrol. 2023. PMID: 38230297 Free PMC article. Review. - The influence of amoeba metal homeostasis on antifungal activity against Cryptococcus gattii.
João MED, Tavanti AG, Vargas AN, Kmetzsch L, Staats CC. João MED, et al. Genet Mol Biol. 2024 Jul 29;47(2):e20230320. doi: 10.1590/1678-4685-GMB-2023-0320. eCollection 2024. Genet Mol Biol. 2024. PMID: 39093931 Free PMC article. - Phenotypic switching in a Cryptococcus neoformans variety gattii strain is associated with changes in virulence and promotes dissemination to the central nervous system.
Jain N, Li L, McFadden DC, Banarjee U, Wang X, Cook E, Fries BC. Jain N, et al. Infect Immun. 2006 Feb;74(2):896-903. doi: 10.1128/IAI.74.2.896-903.2006. Infect Immun. 2006. PMID: 16428732 Free PMC article. - Role of phagocytosis in the virulence of Cryptococcus neoformans.
Del Poeta M. Del Poeta M. Eukaryot Cell. 2004 Oct;3(5):1067-75. doi: 10.1128/EC.3.5.1067-1075.2004. Eukaryot Cell. 2004. PMID: 15470235 Free PMC article. Review. No abstract available.
References
- Littman M L. Am J Med. 1959;27:976–988. - PubMed
Publication types
MeSH terms
Substances
Grants and funding
- AI33774/AI/NIAID NIH HHS/United States
- R01 AI033774/AI/NIAID NIH HHS/United States
- T32GM 07491/GM/NIGMS NIH HHS/United States
- R01 HL059842/HL/NHLBI NIH HHS/United States
- AI23549/AI/NIAID NIH HHS/United States
- AI3342/AI/NIAID NIH HHS/United States
- R01 AI023549/AI/NIAID NIH HHS/United States
- T32 GM007491/GM/NIGMS NIH HHS/United States
- HL-59842-01/HL/NHLBI NIH HHS/United States
LinkOut - more resources
Full Text Sources
Other Literature Sources


