During Trypanosoma cruzi infection CD1d-restricted NK T cells limit parasitemia and augment the antibody response to a glycophosphoinositol-modified surface protein - PubMed (original) (raw)
During Trypanosoma cruzi infection CD1d-restricted NK T cells limit parasitemia and augment the antibody response to a glycophosphoinositol-modified surface protein
Malcolm S Duthie et al. Infect Immun. 2002 Jan.
Abstract
Trypanosoma cruzi is a protozoan parasite that chronically infects many mammalian species and in humans causes Chagas' disease, a chronic inflammatory disease. The parasite expresses glycophosphoinositol (GPI), which potently stimulates interleukin 12 (IL-12) production. During T. cruzi infection IL-12, and possibly GPI, might stimulate NK T cells to affect the protective and chronic inflammatory responses. Here we report that during T. cruzi infection CD1d-restricted NK T cells are stimulated as NK T-cell-deficient mice have greater parasitemia. Furthermore, during T. cruzi infection the percentages of NK T cells in the liver and spleen become decreased for prolonged periods of time, and in vitro stimulation of NK T cells derived from livers of chronically infected mice, compared to uninfected mice, results in increased gamma interferon and IL-4 secretion. Moreover, in NK T-cell-deficient mice the chronic-phase antibody response to a GPI-modified surface protein is decreased. These results indicate that, during the acute infection, NK T cells limit parasitemia and that, during the chronic phase, NK T cells augment the antibody response. Thus, during T. cruzi infection the quality of an individual's NK T-cell response can affect the level of parasitemia and parasite tissue burden, the intensity of the chronic inflammatory responses, and possibly the outcome of Chagas' disease.
Figures
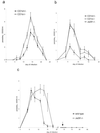
FIG. 1.
During acute T. cruzi infection NK T-cell-deficient mice have increased parasitemia. In these experiments groups of five mice were infected with T. cruzi and parasitemia was monitored. (a) C57BL/6 CD1d+/− or CD1d−/− mice; (b) C57BL/6 CD1d+/−, CD1d−/−, or Jα281−/− mice; (c) BALB/c wild-type or Jα281−/− mice. C57BL/6 mice were infected with 105 trypomastigotes (a and b), and BALB/c mice were infected with 5 × 10⁴ trypomastigotes (c). (c) On day 68 of the infection (arrow) the mice received a second inoculation of 106 trypomastigotes. The mean parasitemia and SEM (error bar) per group are shown. The cumulative parasitemia for each group was compared: (a) P < 0.005; (b) CD1d−/− or Jα281−/− versus CD1d+/−, P < 0.001; (c) P < 0.001.
FIG. 2.
During T. cruzi infection liver and spleen NK T-cell and NK cell population sizes are decreased. C57BL/6 mice were infected with 105 trypomastigotes, and at the indicated days of the infection liver and spleen mononuclear cells were stained with fluorescent MAbs to NK1.1 and CD3. (a) Each plot presents data of an individual representative mouse. (b and c) The mean percentages of NK T cells (CD3+ NK1.1+) (total bars) or CD4+ NK1.1+ cells (black bars) in livers (b) and spleens (c) of several mice are shown. The numbers above the bars indicate the number of mice analyzed on that day of the infection. (d) The mean percentages of NK cells (CD3− NK1.1+) in livers (circles) or spleens (squares) are shown. On the different days of the infection the same numbers of livers or spleens were analyzed as indicated in panels b and c. Symbols: *, P < 0.05; **, P < 0.01 versus preinfection (day 0). Error bars (b, c, and d), SEM.
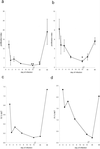
FIG. 3.
The proliferative response following α-GalCer stimulation of liver and spleen cells isolated from _T. cruzi_-infected mice. Wild-type C57BL/6 mice were infected with 105 trypomastigotes and at different days of the infection liver (a) or spleen (b) cells were isolated and cultured for 72 h in the presence of α-GalCer (100 ng/ml) or diluent only. [3H]thymidine was added for the last 24 h. (a and b) The mean proliferation index and SEM of three independent experiments are presented. In each independent experiment each sample was analyzed in triplicate, and the mean value was used to calculate the proliferation index. (c and d) The mean proliferation index is divided by the mean percentage of NK T cells. The percentage of NK T cells was determined as described in the legend to Fig. 2. Symbols: *, P < 0.05; **, P < 0.01 compared to uninfected mice (day 0).
FIG. 4.
IFN-γ and IL-4 production following α-GalCer stimulation of liver or spleen cells isolated from _T. cruzi_-infected mice. (a and b) Liver cells (closed circles) and spleen cells (open circles) were prepared from wild-type C57BL/6 mice that were uninfected or infected (105 trypomastigotes) for 3 or 14 days. Data of one of three experiments with similar results are presented. (c and d) Cells from uninfected mice (open bars) or mice infected (closed bars) (105 trypomastigotes) for 90 to 120 days were incubated at 3 × 10⁵ per well for 96 h in media with α-GalCer (100 ng/ml) or diluent only, and the supernatants were analyzed by ELISA for IFN-γ or IL-4. The mean data of eight mice derived from three independent experiments are presented. The data represent cytokines detected following α-GalCer incubation minus cytokines detected following diluent-only incubation. Following diluent-only incubation no liver IFN-γ or spleen IL-4 was detected. The amounts of IL-4 detected in liver following diluent-only incubation were as follows: uninfected mice, 59 pg/ml; day 3 of infection, 187 pg/ml; day 14 of infection, 270 pg/ml. The amounts of IFN-γ detected in spleen following diluent-only incubation were as follows: uninfected, 26 pg/ml; day 3 of infection, 0 pg/ml; day 14 of infection, 330 pg/ml.
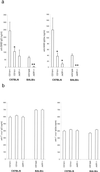
FIG. 5.
Comparison of antibody responses of chronically infected NK T-cell-deficient and normal mice to GPI-modified SA85-1.1 protein. Chronically infected NK T-cell-deficient and normal mice were infected with T. cruzi, and during the chronic phase, serum samples from individual mice were obtained and the anti-SA85-1.1 and anti-trypomastigote IgG and IgG2a antibody concentrations were determined. C57BL/6 mice were infected with 105 trypomastigotes, and BALB/c mice were infected with 5 × 10⁴ trypomastigotes. The bars represent the mean antibody concentration of 10 C57BL/6 CD1d−/−, 10 C57BL/6 CD1d+/−, and 5 C57BL/6 Jα281−/− mice and 5 BALB/c Jα281−/− and 5 BALB/c wild-type mice. Symbols: *, P < 0.05 for NK T-cell-deficient versus CD1d+/− mice; **, P < 0.001 for NK T-cell-deficient mice versus wild-type mice.
Similar articles
- Critical proinflammatory and anti-inflammatory functions of different subsets of CD1d-restricted natural killer T cells during Trypanosoma cruzi infection.
Duthie MS, Kahn M, White M, Kapur RP, Kahn SJ. Duthie MS, et al. Infect Immun. 2005 Jan;73(1):181-92. doi: 10.1128/IAI.73.1.181-192.2005. Infect Immun. 2005. PMID: 15618153 Free PMC article. - Activation of natural killer T cells by alpha-galactosylceramide impairs DNA vaccine-induced protective immunity against Trypanosoma cruzi.
Miyahira Y, Katae M, Takeda K, Yagita H, Okumura K, Kobayashi S, Takeuchi T, Kamiyama T, Fukuchi Y, Aoki T. Miyahira Y, et al. Infect Immun. 2003 Mar;71(3):1234-41. doi: 10.1128/IAI.71.3.1234-1241.2003. Infect Immun. 2003. PMID: 12595437 Free PMC article. - NK1.1+ cells and T-cell activation in euthymic and thymectomized C57Bl/6 mice during acute Trypanosoma cruzi infection.
Cardillo F, Cunha FQ, Tamashiro WM, Russo M, Garcia SB, Mengel J. Cardillo F, et al. Scand J Immunol. 2002 Jan;55(1):96-104. doi: 10.1046/j.1365-3083.2002.01034.x. Scand J Immunol. 2002. PMID: 11841697 - Role of the Complement System in the Modulation of T-Cell Responses in Chronic Chagas Disease.
Caputo MB, Elias J, Cesar G, Alvarez MG, Laucella SA, Albareda MC. Caputo MB, et al. Front Cell Infect Microbiol. 2022 Jun 30;12:910854. doi: 10.3389/fcimb.2022.910854. eCollection 2022. Front Cell Infect Microbiol. 2022. PMID: 35846776 Free PMC article. Review. - Nonsteroidal Anti-Inflammatory Drugs and Experimental Chagas Disease: An Unsolved Question.
Nicolau ST, Tres DP, Ayala TS, Menolli RA. Nicolau ST, et al. Parasite Immunol. 2024 Jul;46(7):e13057. doi: 10.1111/pim.13057. Parasite Immunol. 2024. PMID: 39008292 Review.
Cited by
- CD39 expression by regulatory T cells participates in CD8+ T cell suppression during experimental Trypanosoma cruzi infection.
Araujo Furlan CL, Boccardo S, Rodriguez C, Mary VS, Gimenez CMS, Robson SC, Gruppi A, Montes CL, Acosta Rodríguez EV. Araujo Furlan CL, et al. PLoS Pathog. 2024 Apr 29;20(4):e1012191. doi: 10.1371/journal.ppat.1012191. eCollection 2024 Apr. PLoS Pathog. 2024. PMID: 38683845 Free PMC article. - Spatial distribution of IL4 controls iNKT cell-DC crosstalk in tumors.
Wang L, Liu Z, Wang L, Wu Q, Li X, Xie D, Zhang H, Zhang Y, Gu L, Xue Y, Yue T, Liu G, Ji W, Wei H, Xu T, Bai L. Wang L, et al. Cell Mol Immunol. 2020 May;17(5):496-506. doi: 10.1038/s41423-019-0243-z. Epub 2019 Jun 3. Cell Mol Immunol. 2020. PMID: 31160756 Free PMC article. - The Influence of Invariant Natural Killer T Cells on Humoral Immunity to T-Dependent and -Independent Antigens.
Lang ML. Lang ML. Front Immunol. 2018 Feb 22;9:305. doi: 10.3389/fimmu.2018.00305. eCollection 2018. Front Immunol. 2018. PMID: 29520280 Free PMC article. Review. - Parasites and immunotherapy: with or against?
Yousofi Darani H, Yousefi M, Safari M, Jafari R. Yousofi Darani H, et al. J Parasit Dis. 2016 Jun;40(2):217-26. doi: 10.1007/s12639-014-0533-4. Epub 2014 Aug 31. J Parasit Dis. 2016. PMID: 27413282 Free PMC article. - Immunity and immune modulation in Trypanosoma cruzi infection.
Cardillo F, de Pinho RT, Antas PR, Mengel J. Cardillo F, et al. Pathog Dis. 2015 Dec;73(9):ftv082. doi: 10.1093/femspd/ftv082. Epub 2015 Oct 4. Pathog Dis. 2015. PMID: 26438729 Free PMC article. Review.
References
- Antunez, M. I., and R. L. Cardoni. 2000. IL-12 and IFN-gamma production, and NK cell activity, in acute and chronic experimental Trypanosoma cruzi infections. Immunol. Lett. 71:103–109. - PubMed
- Apostolou, I., Y. Takahama, C. Belmant, T. Kawano, M. Huerre, G. Marchal, J. Cui, M. Taniguchi, H. Nakauchi, J. J. Fournie, P. Kourilsky, and G. Gachelin. 1999. Murine natural killer cells contribute to the granulomatous reaction caused by mycobacterial cell walls. Proc. Natl. Acad. Sci. USA 96:5141–5146. (Erratum, 96:7610.) - PMC - PubMed
Publication types
MeSH terms
Substances
LinkOut - more resources
Full Text Sources
Other Literature Sources
Medical
Molecular Biology Databases


