Homeostatic competition among T cells revealed by conditional inactivation of the mouse Cd4 gene - PubMed (original) (raw)
Homeostatic competition among T cells revealed by conditional inactivation of the mouse Cd4 gene
Q Wang et al. J Exp Med. 2001.
Abstract
Absence of CD4 impairs the efficiency of T cell receptor (TCR) signaling in response to major histocompatibility complex (MHC) class II-presented peptides. Here we use mice carrying a conditional Cd4 allele to study the consequences of impaired TCR signaling after the completion of thymocyte development. We show that loss of CD4 decreases the steady-state proliferation of T cells as monitored by in vivo labeling with bromo-deoxyuridine. Moreover, T cells lacking CD4 compete poorly with CD4-expressing T cells during proliferative expansion after transfer into lymphopenic recipients. The data suggest that T cells compete with one another during homeostatic proliferation, and indicate that the basis of this competition is TCR signaling.
Figures
Figure 1.
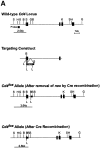
Gene targeting to create a conditional Cd4 allele. (A) Design of the targeting construct used to insert loxP sites into the Cd4 gene and structure of the mutant Cd4 allele before and after Cre recombination. The location of the intron 1 probe used on Southern blot analyses is indicated, as are the sizes of the diagnostic Sac I fragments it detects. Enzyme sites are labeled as follows: _Bam_H I – B; Bgl II – G; Hind III – H; Sac I – S; Kpn I – K; and loxP – L. (B) Southern blot analysis of Sac I–digested tail DNA from mice of the indicated genotypes probed with the intron 1 probe. (C) Southern blot analysis of Sac I–digested tail, thymus, and lymph node DNA from dLCk-hcre transgenic Cd4lox/+ mice hybridized with the intron 1 probe. The sizes of the wild-type and recombined or unrecombined Cd4 lox bands are indicated.
Figure 2.
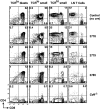
T cell populations in Cd4 lox/− dLck-hcre transgenic mice. Thymocytes at progressively increasing stages of maturity (first three columns) and T cells were analyzed by three-color flow cytometry using directly conjugated fluorescent anti-CD4, CD8, and TCR-β mAbs. All but the last row of contour plots (from Cd4 −/− mice) show cells from mice that carried the conditional Cd4 allele balanced by a null Cd4 allele, and that were also transgenic for the indicated dLck-hcre insertions. The contour plots show the relative representation of populations defined by CD4 and CD8 expression.
Figure 3.
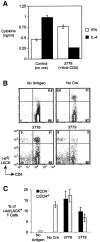
Immune responses mediated by CD4-deficient T cells. (A) Cytokine production by T cells from immunized mice after antigen restimulation in vitro. CD8-depleted spleen cells (containing equivalent numbers of CD4 lineage cells) from immunized mice (100 μg KLH given intraperitoneally in alum 7 d beforehand) were restimulated in vitro with 50 μg/ml KLH for 48 h before harvesting supernatants for IL-4 or IFN-γ-specific ELISAs. Cd4 lox/− dLck-hcre3778 mice were pretreated with cytotoxic anti-CD4 mAb (as described in Materials and Methods) to eliminate CD4-expressing cells (see Fig. 6 A). (B) Antigen-driven clonal expansion of LACK-reactive T cells in the absence of CD4. H-2 db Cd4 lox/− dLck-hcre3778 and dLck-hcre 3779 mice carrying the WT15 LACK-reactive TCR-β transgene (reference 9) were immunized with _Escherichia coli_–derived recombinant LACK in the footpads using Freund's Complete Adjuvant. Popliteal lymph nodes were removed 7 d after immunization and the LACK-reactive T cells they contained were identified by multi-color flow cytometry using a LACK/I-Ad fluorescent multimer (reference 25). The percentages of CD4-expressing and CD4-deficient T helper cells from the immunized mice that stained with the multimer are shown in C.
Figure 4.
Proliferation and phenotype of CD4-deficient T cells. (A) The in vivo rates of cell division for CD4-expressing and CD4-deficient T cells were examined by continuous labeling with BrdUrd. Cells that had undergone DNA synthesis in vivo were identified by multi-color flow cytometry using an anti-BrdUrd mAb. The graph shows the accumulation of cells that stained brightly (reference 49) with the anti-BrdUrd antibody in individual mice analyzed at different time points. The data are representative of those obtained in two independent experiments. (B) Representation of CD62L-expressing CD4+ and CD4− T cells in early (3785) and late (3778) -acting dLck-hcre transgenic Cd4 lox/− mice. (C) Frequency of Annexin V-stained CD4+ and CD4− cells in Cd4 lox/− dLck-hcre transgenic and control mice. Three of the Cd4 lox/− dLck-hcre 3778 mice were treated with cytotoxic anti-CD4 mAb as shown in Fig. 6.
Figure 5.
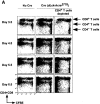
Proliferation of CD4-deficient T cells after adoptive transfer into lymphopenic recipients. (A) FACS® analysis of CFSE-labeled T cells removed from RAG-1−/− recipients of cells from dLck-hcre 3778 transgenic or nontransgenic Cd4 + _/_− mice. The third column shows cells from mice that received CD4-depleted dLck-hcre 3778 Cd4 lox/− T cells. Although tricolor-conjugated anti-CD4 and anti-CD8 antibodies were used together, CD4- and CD8-expressing cells could still be distinguished from one another by their different levels of fluorescence, as indicated. (B) Changes in the relative representation of CD4− and CD4+ T cells in RAG-1−/− mice that received the indicated cell populations. The results of this experiment are representative of two others. Changes in the fraction of cells that had undergone cell division (assessed by CFSE fluorescence) are shown in C.
Figure 6.
Proliferation of CD4-deficient T cells after in vivo depletion of CD4-expressing cells. (A) dLck-hcre 3778 Cd4 lox/− mice were injected four times with 500 μg each of cytotoxic anti-CD4 antibody on days 0, 1, 2, and 6, while being fed BrdUrd continuously in their drinking water. The FACS® plots show the extent of in vivo CD4 depletion after 7 d. (B) Accumulation of BrdUrd-labeled CD4+ and CD4-deficient cells in anti-CD4–treated and untreated Cd4 lox/− dLck-hcre 3778 transgenic mice and nontransgenic controls.
Figure 7.
Decreased surface expression of CD5 on CD4-deficient T cells in dLck-hcre Cd4 lox/− mice. (A) Cell surface CD5 on CD4+ and CD4−CD8− T cells from dLck-hcre 3778 Cd4 lox/− mice. (B) Mean CD5 fluorescence intensity (MFI) of CD4+, CD4−, and CD8+ T cells in dLck-hcre 3778 and dLck-hcre 3779 Cd4 lox/− mice.
Similar articles
- Survival and homeostatic proliferation of naive peripheral CD4+ T cells in the absence of self peptide:MHC complexes.
Clarke SR, Rudensky AY. Clarke SR, et al. J Immunol. 2000 Sep 1;165(5):2458-64. doi: 10.4049/jimmunol.165.5.2458. J Immunol. 2000. PMID: 10946271 - TCR signaling for initiation and completion of thymocyte positive selection has distinct requirements for ligand quality and presenting cell type.
Yasutomo K, Lucas B, Germain RN. Yasutomo K, et al. J Immunol. 2000 Sep 15;165(6):3015-22. doi: 10.4049/jimmunol.165.6.3015. J Immunol. 2000. PMID: 10975810 - Interactions between MHC molecules and co-receptors of the TCR.
König R. König R. Curr Opin Immunol. 2002 Feb;14(1):75-83. doi: 10.1016/s0952-7915(01)00300-4. Curr Opin Immunol. 2002. PMID: 11790535 Review. - The different roles of MHC class recognition in thymocyte CD4 versus CD8 lineage commitment and positive selection.
van Meerwijk JP, Germain RN. van Meerwijk JP, et al. Semin Immunol. 1994 Aug;6(4):231-9. doi: 10.1006/smim.1994.1030. Semin Immunol. 1994. PMID: 8000032 Review.
Cited by
- The mitochondrial fission protein DRP1 influences memory CD8+ T cell formation and function.
Stevens MG, Mason FM, Bullock TNJ. Stevens MG, et al. J Leukoc Biol. 2024 Mar 29;115(4):679-694. doi: 10.1093/jleuko/qiad155. J Leukoc Biol. 2024. PMID: 38057151 - Enhanced CD19 activity in B cells contributes to immunodeficiency in mice deficient in the ICF syndrome gene Zbtb24.
Ying Z, Hardikar S, Plummer JB, Hamidi T, Liu B, Chen Y, Shen J, Mu Y, McBride KM, Chen T. Ying Z, et al. Cell Mol Immunol. 2023 Dec;20(12):1487-1498. doi: 10.1038/s41423-023-01106-w. Epub 2023 Nov 22. Cell Mol Immunol. 2023. PMID: 37990035 - Intrinsic STAT4 Expression Controls Effector CD4 T Cell Migration and Th17 Pathogenicity.
Buzzelli AA, McWilliams IL, Shin B, Bryars MT, Harrington LE. Buzzelli AA, et al. J Immunol. 2023 Jun 1;210(11):1667-1676. doi: 10.4049/jimmunol.2200606. J Immunol. 2023. PMID: 37093664 Free PMC article. - Infiltration of Tumors Is Regulated by T cell-Intrinsic Nitric Oxide Synthesis.
Cunha PP, Bargiela D, Minogue E, Krause LCM, Barbieri L, Brombach C, Gojkovic M, Marklund E, Pietsch S, Foskolou I, Branco CM, Veliça P, Johnson RS. Cunha PP, et al. Cancer Immunol Res. 2023 Mar 1;11(3):351-363. doi: 10.1158/2326-6066.CIR-22-0387. Cancer Immunol Res. 2023. PMID: 36574610 Free PMC article. - HIF-1 stabilization in T cells hampers the control of Mycobacterium tuberculosis infection.
Liu R, Muliadi V, Mou W, Li H, Yuan J, Holmberg J, Chambers BJ, Ullah N, Wurth J, Alzrigat M, Schlisio S, Carow B, Larsson LG, Rottenberg ME. Liu R, et al. Nat Commun. 2022 Sep 5;13(1):5093. doi: 10.1038/s41467-022-32639-9. Nat Commun. 2022. PMID: 36064840 Free PMC article.
References
- Takeda, S., H.R. Rodewald, H. Arakawa, H. Bluethmann, and T. Shimizu. 1996. MHC class II molecules are not required for survival of newly generated CD4+ T cells, but affect their long-term life span. Immunity. 5:217–228. - PubMed
- Boursalian, T.E., and K. Bottomly. 1999. Survival of naive CD4 T cells: roles of restricting versus selecting MHC class II and cytokine milieu. J. Immunol. 162:3795–3801. - PubMed
- Clarke, S.R., and A.Y. Rudensky. 2000. Survival and homeostatic proliferation of naive peripheral CD4+ T cells in the absence of self peptide:MHC complexes. J. Immunol. 165:2458–2464. - PubMed
- Rooke, R., C. Waltzinger, C. Benoist, and D. Mathis. 1997. Targeted complementation of MHC class II deficiency by intrathymic delivery of recombinant adenoviruses. Immunity. 7:123–134. - PubMed
Publication types
MeSH terms
Substances
LinkOut - more resources
Full Text Sources
Molecular Biology Databases
Research Materials


