Critical roles of PPAR beta/delta in keratinocyte response to inflammation - PubMed (original) (raw)
Critical roles of PPAR beta/delta in keratinocyte response to inflammation
N S Tan et al. Genes Dev. 2001.
Abstract
The immediate response to skin injury is the release of inflammatory signals. It is shown here, by use of cultures of primary keratinocytes from wild-type and PPAR beta/delta(-/-) mice, that such signals including TNF-alpha and IFN-gamma, induce keratinocyte differentiation. This cytokine-dependent cell differentiation pathway requires up-regulation of the PPAR beta/delta gene via the stress-associated kinase cascade, which targets an AP-1 site in the PPAR beta/delta promoter. In addition, the pro-inflammatory cytokines also initiate the production of endogenous PPAR beta/delta ligands, which are essential for PPAR beta/delta activation and action. Activated PPAR beta/delta regulates the expression of genes associated with apoptosis resulting in an increased resistance of cultured keratinocytes to cell death. This effect is also observed in vivo during wound healing after an injury, as shown in dorsal skin of PPAR beta/delta(+/+) and PPAR beta/delta(+/-) mice.
Figures
Figure 1
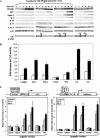
External signals stimulate PPARβ expression and cell differentiation in primary mouse keratinocyte cultures. (A) Apoptosis-derived CM and necrosis-derived CM induce keratinocyte differentiation. Primary keratinocytes from wild-type (first, third, and fifth panels) or from PPARβ−/− mice (second and fourth panels) were exposed at time 0 (usually after two or three passages) to conditioned medium (CM) from mixed leukocyte reactions (MLR), prepared either with apoptotic fibroblasts (first and second panels) or with necrotic cells (third, fourth, and fifth panels). Keratinocytes were lysed after different times of exposure to CM as indicated, and the expression of PPARβ was evaluated by RPA. The expression of involucrin (INV), transglutaminase I (TgaseI), was used as markers of keratinocyte differentiation. The expression of keratin (K) K6, K10, and K17 reflects different pathways of keratinocyte differentiation. Cyclin A (Cyc A) expression indicated the status of the cell with respect to cell cycle. In the fifth panel, the necrosis-derived CM was precleared of TNF-α. (B) The major pro-inflammatory mediators TNF-α, IFN-γ, and TPA up-regulate PPARβ expression. Primary keratinocytes from wild-type (first, third, and fifth panels) or from PPARβ−/− mice (second, fourth, and sixth panels) were cultured in KSFM and exposed at time 0 to TNF-α 5 ng/ml (first and second panels) IFN-γ 5 ng/ml (third and fourth panels). or TPA 20 ng/ml (fifth and sixth panels). In all three treatments, the expression of all differentiation markers is strongly reduced and delayed in PPARβ−/− cells.
Figure 2
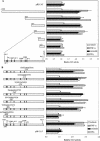
Identification of the region in the PPARβ promoter that mediates the TNF-α, TPA, and ceramide responses. (A) _PPAR_β promoter 5′-deletion mutants. Plasmids are named according to the length of the promoter region they contain upstream from the transcription start site. Keratinocytes in culture were cotransfected with a CAT reporter driven by the various _PPAR_β promoter constructs and pCMV-β-galactosidase as a control of transfection efficiency. Keratinocyte cultures were treated for 24 h with the inducers indicated. Results were normalized to β-galactosidase activity and are presented as relative CAT activity compared with that of the promoterless vector pBLCAT alone. (B) TNFα-, TPA-, and Cer-signaling target an AP-1(−414) of the PPARβ promoter. The hatched bar depicts site-directed mutations of the transcription factor binding sites. The mutations introduced into the site are indicated as underlined nucleotides above the respective hatched bar. The numbers associated with the sites indicate their position relative to the transcription start site. Data are means of six independent experiments. Vehicles for TPA, TNF-α, and Cer were ethanol, PBS, and DMSO, respectively.
Figure 3
Signaling cascades that mediate the effects of TNF-α, TPA, and Cer on the PPARβ gene in keratinocytes. (A) (Overall scheme) The solid arrows represent the major TNFα-activated, FAN-mediated, pathway regulating PPARβ expression. The cascade invoked by TPA is depicted by the dashed arrows. (B) TNF-α induces PPARβ gene expression through FAN and Cer. Keratinocytes were cotransfected with expression vectors for wild-type FAN (wtFAN, second panel) or a dominant-negative form of FAN (dnFAN, third and fourth panels) and pCMV-β-galactosidase as internal control. Transfected keratinocytes were treated with TNF-α and RPA were performed at the indicated times. (fourth panel) Suppression of PPARβ expression by dnFAN was rescued by addition of exogenous ceramide at 12 h post-transfection. (first panel) Control experiment with TNF-α alone; (fifth panel) effect of ceramide in absence of TNF-α treatment. (C) Regulation of PPARβ via the stress-associated kinase pathway. Keratinocytes were transfected with a CAT reporter driven by the pPPARβ(−445) promoter region together with expression vectors encoding dominant negative (dn) or constitutively active (ca) kinases. The empty vector pCDNA 3.1 was used as a control (vector). Transfected keratinocytes were treated with an inducer (TNF-α, ceramide, or TPA) and CAT activity was measured 24 h post-treatment. SB203580 (10 μM) is a specific inhibitor of p38 and was added 1 h prior to treatment with the inducers. Values are means of six independent experiments.
Figure 4
PPARβ accelerates keratinocyte differentiation. (A) Overexpression and activation of PPARβ stimulates keratinocyte differentiation. Keratinocytes were transfected with a wtPPARβ expression vector and lysed for RPA at various time points post-transfection, as indicated. Overexpression of PPARβ alone is not sufficient to trigger keratinocyte differentiation (first panel), which requires a 6-h exposure to a PPARβ-specific ligand L165041 (LD) (second panel). Better results were obtained with a repeated exposure to LD [6 h, followed by an additional 18 h with fresh medium containing the second dose (third panel)]. This latter dose regime was also able to slightly induce the expression of differentiation markers in absence of ectopical expression of PPARβ (fourth panel). (B) Activation of the PPARβ LBD by cytokines. Keratinocytes were cotransfected with an expression vector for a GAL4 DBD–PPARβ LBD, the Gal4 responsive reporter vector pG5CAT (Clontech), and the pCMV-β-galactosidase vector. CAT and β-galactosidase activities were measured after 24-h exposure to two different concentrations (open and solid bars) of PPARβ selective ligand L165041 (LD; 1, 5 μM), IFN-γ (10, 25 ng/ml), TNF-α (10, 25 ng/ml), TGF-β (10, 25 ng/ml), TPA (10, 20 ng/ml), Ceramide (Cer; 10, 20 μM), or arachidonic acid (AA; 10, 20 μM). Exposure to IFN-γ, TNF-α, TPA, and Cer resulted in a dose-dependent increase of the CAT reporter activity. (C) Total lipid extract of cytokine-activated keratinocytes activates PPARβ. Total lipid extract were prepared from keratinocytes untreated (control), or exposed to vehicle or to various pro-inflammatory mediators, as indicated. (Left) Transfections were performed as in A. Cells were then exposed to 1 or 2 μL of a total lipid extract for 24 h and CAT activity was measured. (Right) Keratinocytes were transfected with the wtPPARβ expression vector, pGL-3xPPRE-tk-luc reporter gene, and pCMV-β-galactosidase. Normalized reporter activity is shown as fold increase as compared with control.
Figure 5
PPARβ target genes are associated with apoptosis. RPA was performed using total RNA (2.5 μg) isolated from keratinocytes derived from PPARβ+/+ and PPARβ−/− mice (left); or from wild-type keratinocytes not treated (−) or treated for 12 and 24 h with 1μM of the PPARβ specific ligand L165041 (LD; middle); and with 5 or 10 μg/ml of cycloheximide (CH; right). Two representative samples are shown per condition. Numbers below each band represent the fold differences in mRNA expression levels with respect to the wild-type or untreated keratinocytes.
Figure 6
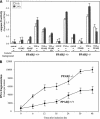
Inflammation-induced PPARβ expression protects keratinocytes from apoptosis. (A) Elevated PPARβ expression inhibits TNFα-induced apoptosis. Keratinocytes prepared from PPARβ+/+,PPARβ+/−, and PPARβ−/− mice were either transfected with expression vectors harboring the wtPPARβ and/or cultured in the absence or presence of TNF-α and L165041 (LD, 5 μM) as indicated. The level of TNFα-induced apoptosis was monitored by caspase 8 activity. Keratinocytes expressing wtPPARβ were more resistant to apoptosis signals, whereas PPARβ+/− cells showed an increase susceptibility. PPARβ−/− keratinocytes exhibited higher basal caspase 8 activity and were more sensitive to TNFα-induced apoptosis, but could be rescued by transfection with the vector expressing wtPPARβ. Values are means of three independent experiments. (B) PPARβ−/− keratinocytes are more susceptible to TNFα-induced apoptosis. Culture of primary keratinocytes from wild-type and from PPARβ−/− mice were exposed to TNF-α. Apoptosis was measured by radioactive DNA fragmentation assay over indicated periods of time. Values are means of three independent experiments.
Figure 7
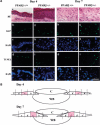
PPARβ controls the balance between apoptosis and proliferation of keratinocytes in vivo. (A) Increased proliferation and elevated apoptosis in the PPARβ+/− mice. The Ki67 and TUNEL-positive keratinocytes were revealed by fluorescent labeling on skin sections obtained at days 4 and 7 after a dorsal skin injury. The figure shows representative fields of the labelings obtained at the wound edges (region c/c' of the epithelium, according to B). PPARβ+/+ (a–e) and PPARβ+/− (f–j) mice skin sections after hematoxylin/eosin staining (HE) (a,f), Ki67 immunostaining (b,g), TUNEL (d,i) and DAPI staining (c,h,e,j). Magnification bar, 50 μm. (B) Regions of a skin wound at days 4 and 7 after a full-thickness biopsy. (C) Clot; (WB) wound bed. The positions of the 10 microscope fields in which apoptosis and cell proliferation were quantified is indicated as regions a–e and a' –e'. The quantification (summarized in Table 1) is a mean of the number of proliferative or apoptotic positive cells counted in regions e to e' of the epithelium. A shows pictures taken in region c and c', as representative fields.
Similar articles
- Impaired skin wound healing in peroxisome proliferator-activated receptor (PPAR)alpha and PPARbeta mutant mice.
Michalik L, Desvergne B, Tan NS, Basu-Modak S, Escher P, Rieusset J, Peters JM, Kaya G, Gonzalez FJ, Zakany J, Metzger D, Chambon P, Duboule D, Wahli W. Michalik L, et al. J Cell Biol. 2001 Aug 20;154(4):799-814. doi: 10.1083/jcb.200011148. J Cell Biol. 2001. PMID: 11514592 Free PMC article. - FGF-2, IL-1beta and TGF-beta regulate fibroblast expression of S100A8.
Rahimi F, Hsu K, Endoh Y, Geczy CL. Rahimi F, et al. FEBS J. 2005 Jun;272(11):2811-27. doi: 10.1111/j.1742-4658.2005.04703.x. FEBS J. 2005. PMID: 15943814 - [Role of the peroxisome proliferator-activated receptors (PPARS) in the regulation of lipids and inflammation control].
Bocher V, Chinetti G, Fruchart JC, Staels B. Bocher V, et al. J Soc Biol. 2002;196(1):47-52. J Soc Biol. 2002. PMID: 12134632 Review. French. - Peroxisome proliferator-activated receptor (PPAR)-beta as a target for wound healing drugs: what is possible?
Tan NS, Michalik L, Desvergne B, Wahli W. Tan NS, et al. Am J Clin Dermatol. 2003;4(8):523-30. doi: 10.2165/00128071-200304080-00001. Am J Clin Dermatol. 2003. PMID: 12862494 Review.
Cited by
- The role of barrier genes in epidermal malignancy.
Darido C, Georgy SR, Jane SM. Darido C, et al. Oncogene. 2016 Nov 3;35(44):5705-5712. doi: 10.1038/onc.2016.84. Epub 2016 Apr 4. Oncogene. 2016. PMID: 27041586 Review. - Expression of Prostacyclin-Synthase in Human Breast Cancer: Negative Prognostic Factor and Protection against Cell Death In Vitro.
Klein T, Benders J, Roth F, Baudler M, Siegle I, Kömhoff M. Klein T, et al. Mediators Inflamm. 2015;2015:864136. doi: 10.1155/2015/864136. Epub 2015 Jul 27. Mediators Inflamm. 2015. PMID: 26265889 Free PMC article. - PPAR delta: a dagger in the heart of the metabolic syndrome.
Barish GD, Narkar VA, Evans RM. Barish GD, et al. J Clin Invest. 2006 Mar;116(3):590-7. doi: 10.1172/JCI27955. J Clin Invest. 2006. PMID: 16511591 Free PMC article. Review. - Fatty acid-binding protein 5 and PPARbeta/delta are critical mediators of epidermal growth factor receptor-induced carcinoma cell growth.
Kannan-Thulasiraman P, Seachrist DD, Mahabeleshwar GH, Jain MK, Noy N. Kannan-Thulasiraman P, et al. J Biol Chem. 2010 Jun 18;285(25):19106-15. doi: 10.1074/jbc.M109.099770. Epub 2010 Apr 27. J Biol Chem. 2010. PMID: 20424164 Free PMC article. - Role of Peroxisome Proliferator-Activated Receptor (PPAR)δ in Embryonic Stem Cell Proliferation.
Lee MY, Lee YJ, Kim YH, Lee SH, Park JH, Kim MO, Suh HN, Ryu JM, Yun SP, Jang MW, Han HJ. Lee MY, et al. Int J Stem Cells. 2009 May;2(1):28-34. doi: 10.15283/ijsc.2009.2.1.28. Int J Stem Cells. 2009. PMID: 24855517 Free PMC article. Review.
References
- Adam-Klages S, Adam D, Wiegmann K, Struve S, Kolanus W, Schneider-Mergener J, Kronke M. FAN, a novel WD-repeat protein, couples the p55 TNF-receptor to neutral sphingomyelinase. Cell. 1996;86:937–947. - PubMed
- Amri EZ, Bonino F, Ailhaud G, Abumrad NA, Grimaldi PA. Cloning of a protein that mediates transcriptional effects of fatty acids in preadipocytes. Homology to peroxisome proliferator-activated receptors. J Biol Chem. 1995;270:2367–2371. - PubMed
- Banchereau J, Steinman RM. Dendritic cells and the control of immunity. Nature. 1998;392:245–252. - PubMed
- Davis RJ. Signal transduction by the JNK group of MAP kinases. Cell. 2000;103:239–252. - PubMed
Publication types
MeSH terms
Substances
LinkOut - more resources
Full Text Sources
Other Literature Sources
Molecular Biology Databases


