Photic and circadian expression of luciferase in mPeriod1-luc transgenic mice invivo - PubMed (original) (raw)
Photic and circadian expression of luciferase in mPeriod1-luc transgenic mice invivo
Lisa D Wilsbacher et al. Proc Natl Acad Sci U S A. 2002.
Abstract
A conserved transcription-translation negative feedback loop forms the molecular basis of the circadian oscillator in animals. Molecular interactions within this loop have been relatively well characterized in vitro and in cell culture; however, in vivo approaches are required to assess the functional significance of these interactions. Here, regulation of circadian gene expression was studied in vivo by using transgenic reporter mouse lines in which 6.75 kb of the mouse Period1 (mPer1) promoter drives luciferase (luc) expression. Six mPer1-luc transgenic lines were created, and all lines express a daily rhythm of luc mRNA in the suprachiasmatic nuclei (SCN). Each mPer1-luc line also sustains a long-term circadian rhythm of luminescence in SCN slice culture. A 6-h light pulse administered during the early subjective night rapidly induces luc mRNA expression in the SCN; however, high luc mRNA levels are sustained, whereas endogenous mPer1 mRNA levels return to baseline, suggesting that posttranscriptional events mediate the down-regulation of mPer1 after exposure to light. This approach demonstrates that the 6.75-kb mPer1 promoter fragment is sufficient to confer both circadian and photic regulation in vivo and reveals a potential posttranscriptional regulatory mechanism within the mammalian circadian oscillator.
Figures
Figure 1
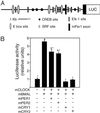
mPer1_-luc construct and activity in transfection-based reporter assay. (A) The 6.75-kb_mPer1 promoter contains five E-box sites, five putative cAMP response element-binding protein (CREB) sites, eight putative Elk1 sites, and three putative serum response factor (SRF) sites as well as exon 1 and the 5′ UTR of exon 2. (B) Transfection-based_luc_ assays in NIH 3T3 fibroblasts using the_mPer1_-luc reporter. +, indicates the presence of an expression plasmid; *, indicates a significant difference from the condition of_mPer1_-luc reporter alone; †, indicates a significant difference from the condition of_mPer1_-luc reporter in the presence of only mCLOCK and mBMAL [generalized linear model ANOVA,F(5,35) = 147.91; P < 1.0 × 10⁻⁶; Scheffé's post hoc comparison,P ≤ 0.05]. Results represent two independent experiments with n = 3 of each condition.
Figure 2
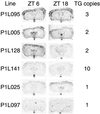
Diurnal variation of luc mRNA expression in the SCN of P1L mice. P1L mice were killed at ZTs 6 and 18, and coronal brain sections were hybridized in situ with a_luc_ riboprobe. In all lines, higher expression occurs in the SCN (arrows) at ZT 6, whereas low-to-undetectable expression occurs at ZT 18. Diurnal variation was not observed in other brain regions. TG copies, indicates the transgene copy number for each line.
Figure 3
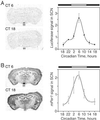
Circadian rhythm of luc expression in P1L mice. Mice were maintained in constant darkness for at least 7 days before being killed, and the endogenous circadian rhythm of each animal was measured. Three to five animals were collected at each CT point beginning at 18. (A) Expression of luc. (B) Expression of endogenous_mPer1_.
Figure 4
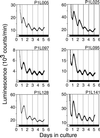
Persistent circadian rhythms of luminescence in SCN culture. Animals were entrained to a 12-h light/12-h dark cycle. Mice were killed 1 h before lights-off, and SCN explants were cultured for 5 days in the presence of luciferin.
Figure 5
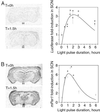
Light-responsiveness of mPer1_-luc expression in transgenic mice. Mice were maintained in constant darkness for at least 7 days before the experiment, and the endogenous circadian rhythm of each animal was measured. At CT 17, mice were transferred to a light box. Time-course graphs indicate the fold induction from baseline expression at CT 17. The line through each data set is the nonlinear least-squares fit to the mean for each time point assuming a biexponential function (see_Results). (A) Time course of_luc_ mRNA levels. *, denotes significant differences in signal intensity between time = 0 (dark control) and the indicated time [generalized linear model ANOVA,F(6,22) = 5.32; P = 0.004039]. Biexponential function parameters: λ = 0.46439 and β = 0.46547. (B) Time course of endogenous_mPer1_ mRNA levels. *, denotes significant differences in signal intensity between time = 0 (dark control) and the indicated time [generalized linear model ANOVA,F(6,22) = 9.32; P = 0.000232]. Biexponential function parameters: λ = 0.74934 and β = 0.93453.
Similar articles
- The 5' upstream region of mPer1 gene contains two promoters and is responsible for circadian oscillation.
Yamaguchi S, Mitsui S, Miyake S, Yan L, Onishi H, Yagita K, Suzuki M, Shibata S, Kobayashi M, Okamura H. Yamaguchi S, et al. Curr Biol. 2000 Jul 13;10(14):873-6. doi: 10.1016/s0960-9822(00)00602-3. Curr Biol. 2000. PMID: 10899004 - A new mammalian period gene predominantly expressed in the suprachiasmatic nucleus.
Takumi T, Matsubara C, Shigeyoshi Y, Taguchi K, Yagita K, Maebayashi Y, Sakakida Y, Okumura K, Takashima N, Okamura H. Takumi T, et al. Genes Cells. 1998 Mar;3(3):167-76. doi: 10.1046/j.1365-2443.1998.00178.x. Genes Cells. 1998. PMID: 9619629 - Circadian entrainment aftereffects in suprachiasmatic nuclei and peripheral tissues in vitro.
Molyneux PC, Dahlgren MK, Harrington ME. Molyneux PC, et al. Brain Res. 2008 Sep 4;1228:127-34. doi: 10.1016/j.brainres.2008.05.091. Epub 2008 Jun 14. Brain Res. 2008. PMID: 18598681 - Stochastic phase oscillator models for circadian clocks.
Rougemont J, Naef F. Rougemont J, et al. Adv Exp Med Biol. 2008;641:141-9. doi: 10.1007/978-0-387-09794-7_10. Adv Exp Med Biol. 2008. PMID: 18783177 Review. No abstract available. - The ERE-luc reporter mouse.
Ciana P, Mussi P, Raviscioni M, Biserni A, Ottobrini L, Vegeto E, Maggi A. Ciana P, et al. Ernst Schering Res Found Workshop. 2004;(46):151-68. doi: 10.1007/978-3-662-05386-7_10. Ernst Schering Res Found Workshop. 2004. PMID: 15248510 Review. No abstract available.
Cited by
- Effects of aging on central and peripheral mammalian clocks.
Yamazaki S, Straume M, Tei H, Sakaki Y, Menaker M, Block GD. Yamazaki S, et al. Proc Natl Acad Sci U S A. 2002 Aug 6;99(16):10801-6. doi: 10.1073/pnas.152318499. Epub 2002 Jul 29. Proc Natl Acad Sci U S A. 2002. PMID: 12149444 Free PMC article. - DNA binding, but not interaction with Bmal1, is responsible for DEC1-mediated transcription regulation of the circadian gene mPer1.
Li Y, Song X, Ma Y, Liu J, Yang D, Yan B. Li Y, et al. Biochem J. 2004 Sep 15;382(Pt 3):895-904. doi: 10.1042/BJ20040592. Biochem J. 2004. PMID: 15193144 Free PMC article. - Multi-Level Processes and Retina-Brain Pathways of Photic Regulation of Mood.
Maruani J, Geoffroy PA. Maruani J, et al. J Clin Med. 2022 Jan 16;11(2):448. doi: 10.3390/jcm11020448. J Clin Med. 2022. PMID: 35054142 Free PMC article. Review. - Quantitative Analysis of Bioluminescence Optical Signal.
Niwa K, Kubota H, Enomoto T, Ichino Y, Ohmiya Y. Niwa K, et al. Biosensors (Basel). 2023 Feb 3;13(2):223. doi: 10.3390/bios13020223. Biosensors (Basel). 2023. PMID: 36831989 Free PMC article. Review. - In vivo circadian oscillation of dCREB2 and NF-κB activity in the Drosophila nervous system.
Tanenhaus AK, Zhang J, Yin JC. Tanenhaus AK, et al. PLoS One. 2012;7(10):e45130. doi: 10.1371/journal.pone.0045130. Epub 2012 Oct 15. PLoS One. 2012. PMID: 23077489 Free PMC article.
References
- Dunlap J C. Cell. 1999;96:271–290. - PubMed
- Wilsbacher L D, Takahashi J S. Curr Opin Genet Dev. 1998;8:595–602. - PubMed
- King D P, Takahashi J S. Annu Rev Neurosci. 2000;23:713–742. - PubMed
- Wager-Smith K, Kay S A. Nat Genet. 2000;26:23–27. - PubMed
Publication types
MeSH terms
Substances
LinkOut - more resources
Full Text Sources
Molecular Biology Databases
