Peripheral inflammation sensitizes P2X receptor-mediated responses in rat dorsal root ganglion neurons - PubMed (original) (raw)
Peripheral inflammation sensitizes P2X receptor-mediated responses in rat dorsal root ganglion neurons
Guang-Yin Xu et al. J Neurosci. 2002.
Abstract
ATP-gated P2X receptors in nociceptive sensory neurons participate in transmission of pain signals from the periphery to the spinal cord. To determine the role of P2X receptors under injurious conditions, we examined ATP-evoked responses in dorsal root ganglion (DRG) neurons isolated from rats with peripheral inflammation, induced by injections of complete Freund's adjuvant (CFA) into the hindpaw. Application of ATP induced both fast- and slow-inactivating currents in control and inflamed neurons. CFA treatment had no effect on the affinity of ATP for its receptors or receptor phenotypes. On the other hand, inflammation caused a twofold to threefold increase in both ATP-activated currents, altered the voltage dependence of P2X receptors, and enhanced the expression of P2X2 and P2X3 receptors. The increase in ATP responses gave rise to large depolarizations that exceeded the threshold of action potentials in inflamed DRG neurons. Thus, P2X receptor upregulation could account for neuronal hypersensitivity and contribute to abnormal pain responses associated with inflammatory injuries. These results suggest that P2X receptors are useful targets for inflammatory pain therapy.
Figures
Fig. 1.
Inflammation potentiates ATP-activated currents.A, Examples of currents evoked by ATP application in control rats (CON). ATP (20 μ
m
) activated fast-inactivating (left) and slow-inactivating (right) currents in DRG neurons. The membrane was held at −60 mV. Results were obtained from two different cells. The solid line above each _trace_indicates the period of ATP application. B, Examples of currents evoked by ATP application in rats injected with CFA. Under similar conditions as in A, ATP also evoked fast-inactivating (left) and slow-inactivating (right) currents in DRG cells. The amplitudes of both types of currents were much larger than those obtained in control rats.C, Mean fast and slow current densities from control and CFA rats. The mean peak fast-inactivating (Fast_ P) current density measured in CFA rats was 2.7 times larger than that measured in control rats (Fast_ P: control, 0.30 ± 0.05 pA/μm2, n = 29; CFA, 0.82 ± 0.13 pA/μm2, n = 48; *p < 0.01). The mean peak slow-inactivating (Slow_ P) current density in CFA rats was 2.8 times larger (Slow_ P: control, 0.24 ± 0.05 pA/μm2, n = 25; CFA, 0.68 ± 0.09 pA/μm2,n = 38), and the mean steady-state slow (Slow_ SS) current density was 3.0 times larger than those obtained in control rats (Slow_ SS: control, 0.10 ± 0.02 pA/μm2, n = 25; CFA, 0.30 ± 0.05 pA/μm2, n = 38; *p < 0.01).
Fig. 2.
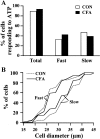
Inflammation does not change the percentages and the size distributions of neurons responding to ATP. A, Percentages of responding cells. The percentage of the total number of cells (Total) responding to ATP was 89.4% (n = 141) in control rats (CON) and 93.8% (n = 276) in CFA rats. The change was not significant (χ2 test;p > 0.05). The percentages of cells with fast-inactivating ATP responses (Fast) (control, 33.3%,n = 47; CFA, 42.8%, n = 118) and the percentages of cells with slow-inactivating ATP responses (Slow) (control, 47.5%, n = 67; CFA, 39.5%, n = 109) were not altered by inflammation. B, Cell size distributions for ATP responses. Distributions of cell diameter were expressed in cumulative histograms, i.e., percentages of cells that responded with either fast or slow ATP responses versus cell diameters that were smaller than the indicated values. In control rats, 50% of cells responding to ATP with fast-inactivating currents (13 of 27 cells tested) had diameters <26 μm; 50% of the cells responding to ATP with slow-inactivating currents (23 of 46 cells tested) had diameters <33 μm. The size difference was significant (p < 0.05; Kolmogorov–Smirnov test). In CFA rats, 50% of the cells responding to ATP with fast-inactivating currents had diameters <26 μm (32 of 65 cells tested); 50% of the cells responding to ATP with slow-inactivating currents had diameters <31 μm (28 of 56 cells tested). CFA treatment did not change the size distribution of cells responding to ATP with either the fast- or slow-inactivating currents.
Fig. 3.
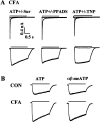
Inflammation does not change the receptor phenotypes. A, Effects of P2X receptor antagonists. In inflamed neurons, the antagonists of P2X receptors suramin (Sur; 30 μ
m
) and PPADS (50 μ
m
) completely blocked both fast- and slow-inactivating currents. TNP-ATP (1 μ
m
) inhibited the fast ATP responses completely and inhibited the slow ATP responses by 98%. Current traces obtained from ATP plus and minus an antagonist were superimposed.B, Effects of the P2X receptor agonist αβmeATP. At saturated concentrations, ATP (100 μ
m
) and αβmeATP (100 μ
m
) elicited similar responses, suggesting minimal contributions of homomeric P2X2, P2X5 receptor-mediated responses to the observed currents. CFA treatment did not alter the effect of αβmeATP. CON, Control.
Fig. 4.
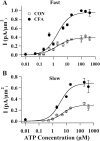
CFA treatment has no effect on the affinity of ATP for P2X receptors. A, Dose–response curves for ATP-evoked fast responses. The peak fast-inactivating ATP responses evoked in control and inflamed neurons were plotted as a function of ATP concentration. The dose–response curves were fit by the Hill equation. For control cells (CON),_I_max = 0.38 ± 0.04 pA/μm2, EC50 = 1.70 ± 0.90 μ
m
, and Hill coefficient = 1. For inflamed cells,_I_max = 0.95 ± 0.06 pA/μm2, EC50 = 2.00 ± 0.69 μ
m
, and Hill coefficient = 1. The data points were obtained from 3–18 cells. B, Dose–response curves for ATP-evoked slow responses. For control cells,_I_max = 0.29 ± 0.02 pA/μm2, EC50 = 5.70 ± 1.40 μ
m
, and Hill coefficient = 1. For inflamed cells,_I_max = 0.68 ± 0.14 pA/μm2, EC50 = 3.60 ± 1.20 μ
m
, and Hill coefficient = 1. The data points were obtained from two to eight cells. Therefore, inflammation did not alter the ATP affinities for P2X receptors, although it greatly enhanced the maximal ATP responses.
Fig. 5.
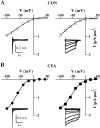
ATP currents in control and inflamed neurons exhibit steep voltage dependence. Examples of current–voltage (I–V) relationships of peak fast (left) and slow (right) ATP currents in control (CON) (A) and CFA (B) neurons. The currents were measured at different holding potentials. The current traces were shown in the_inset_ of each I–V curve. The reversal potentials of the currents did not change after CFA treatment. Data were obtained from four different cells.
Fig. 6.
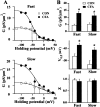
CFA alters the conductance–voltage curves.A, Examples of conductance-voltage (G–V) curves. The data were calculated according to the procedure described in Materials and Methods, Data analyses. The_solid lines_ were the theoretical fit of the Boltzmann equation using the following parameter values. Fast responses: control (CON), _G_max = 5.6 pS/μm2, Z = 1.1, and_V_0.5 = −31.5 mV; CFA,_G_max = 13.4 pS/μm2, Z = 1.2, and_V_0.5 = −51.4 mV. Slow responses: control, _G_max = 6.9 pS/μm2, Z = 0.9, and_V_0.5 = −19.0 mV; CFA,_G_max = 18.5 pS/μm2, Z = 1.1, and_V_0.5 = −39.0 mV. B, Mean parameters obtained from all of the cells tested. Fast responses: control, _G_max = 4.4 ± 0.7 pS/μm2, Z = 0.97 ± 0.07, and _V_0.5 = −35.6 ± 2.9 mV (n = 10); CFA, _G_max= 12.9 ± 1.4 pS/μm2, Z = 0.91 ± 0.01, and _V_0.5 = −49.5 ± 2.3 mV (n = 12). Slow responses: control, _G_max = 5.0 ± 0.9 pS/μm2, Z = 0.92 ± 0.09, and _V_0.5 = −25.4 ± 4.8 mV (n = 6); CFA, _G_max= 11.0 ± 0.1 pA/μm2, Z = 0.95 ± 0.01, and _V_0.5 = −43.5 ± 2.8 mV (n = 12). Inflammation increased _G_max (*p < 0.05; _top_), shifted the _G–V_ curves in the hyperpolarized direction (*_p_ < 0.05;_middle_), and did not change the _Z_(_p_ > 0.05; bottom).
Fig. 7.
Inflammation increases ATP-evoked depolarizations in DRG cells. A, ATP-evoked depolarizations in TTX-sensitive neurons. Top, In control neurons (CON), ATP (20 μ
m
) produced subthreshold depolarizations in most responsive cells. In the cell shown, ATP-evoked depolarization was 13.5 mV before TTX (2 μ
m
) and 13.3 mV after TTX. To inactivate TTX-resistant Na channels, a prepulse depolarized to −15 mV for a period of 8 sec was applied before the application of ATP. With the prepulse, ATP produced a 12.6 mV depolarization. Resting potential was −49 mV. Bottom, In the CFA neuron, ATP evoked an action potential that was blocked by TTX. In the presence of TTX, ATP evoked a depolarization of 36.0 mV without the prepulse and 36.2 mV with the prepulse. Resting potential was −48 mV. Solid lines under current traces indicate the period of ATP applications.B, A bar graph summarizes the data obtained from TTX-sensitive neurons isolated from control and CFA rats. The average ATP-evoked depolarization was 12.4 ± 3.7 mV (n = 4) in control and 30.8 ± 1.5 mV (n = 6) in CFA neurons with both TTX and the prepulse. C, ATP-evoked depolarizations in TTX-resistant neurons. Top, In a control neuron, ATP evoked subthreshold depolarizations of 15.2 mV before TTX and of 14.1 mV after TTX. In the presence of TTX, the depolarized prepulse elicited an action potential that subsided as TTX-resistant channels inactivated. ATP after the prepulse produced a 13.5 mV depolarization. Resting potential was −53 mV. Bottom, After inflammation, ATP evoked an action potential that was insensitive to TTX. With the prepulse, ATP evoked 36.9 mV depolarization in this cell. Resting potential was −52 mV. D, The average depolarization produced by ATP in CFA neurons (32.4 ± 1.5 mV) was significantly larger than that produced in control neurons (15.6 ± 1.7 mV). Data were obtained from four different neurons. *p< 0.01.
Fig. 8.
CFA treatment enhances P2X2 and P2X3 receptor expression. A, Western blots for P2X2 and P2X3 receptors from ganglia of control rats (CON) and rats 5 d after CFA treatment. Actin control for each sample was given.B, Mean density relative to control rats for P2X2 and P2X3 receptors. After inflammation, the relative density of P2X2 and P2X3 receptors were increased by 81 and 82%, respectively (n = 3–5 rats; *p < 0.05; Student's t test).
Similar articles
- Contribution of sensitized P2X receptors in inflamed tissue to the mechanical hypersensitivity revealed by phosphorylated ERK in DRG neurons.
Dai Y, Fukuoka T, Wang H, Yamanaka H, Obata K, Tokunaga A, Noguchi K. Dai Y, et al. Pain. 2004 Apr;108(3):258-266. doi: 10.1016/j.pain.2003.12.034. Pain. 2004. PMID: 15030945 - Characterization of cultured dorsal root ganglion neuron P2X receptors.
Grubb BD, Evans RJ. Grubb BD, et al. Eur J Neurosci. 1999 Jan;11(1):149-54. doi: 10.1046/j.1460-9568.1999.00426.x. Eur J Neurosci. 1999. PMID: 9987019 - Negative cross talk between anionic GABAA and cationic P2X ionotropic receptors of rat dorsal root ganglion neurons.
Sokolova E, Nistri A, Giniatullin R. Sokolova E, et al. J Neurosci. 2001 Jul 15;21(14):4958-68. doi: 10.1523/JNEUROSCI.21-14-04958.2001. J Neurosci. 2001. PMID: 11438571 Free PMC article. - Cell type-specific ATP-activated responses in rat dorsal root ganglion neurons.
Ueno S, Tsuda M, Iwanaga T, Inoue K. Ueno S, et al. Br J Pharmacol. 1999 Jan;126(2):429-36. doi: 10.1038/sj.bjp.0702319. Br J Pharmacol. 1999. PMID: 10077235 Free PMC article. - Alteration of dorsal root ganglion P2X3 receptor expression and function following spinal nerve ligation in the rat.
Kage K, Niforatos W, Zhu CZ, Lynch KJ, Honore P, Jarvis MF. Kage K, et al. Exp Brain Res. 2002 Dec;147(4):511-9. doi: 10.1007/s00221-002-1263-x. Epub 2002 Oct 25. Exp Brain Res. 2002. PMID: 12444483
Cited by
- Enhanced binding capability of nuclear factor-κB with demethylated P2X3 receptor gene contributes to cancer pain in rats.
Zhou YL, Jiang GQ, Wei J, Zhang HH, Chen W, Zhu H, Hu S, Jiang X, Xu GY. Zhou YL, et al. Pain. 2015 Oct;156(10):1892-1905. doi: 10.1097/j.pain.0000000000000248. Pain. 2015. PMID: 26049406 Free PMC article. - Promoted interaction of nuclear factor-κB with demethylated cystathionine-β-synthetase gene contributes to gastric hypersensitivity in diabetic rats.
Zhang HH, Hu J, Zhou YL, Hu S, Wang YM, Chen W, Xiao Y, Huang LY, Jiang X, Xu GY. Zhang HH, et al. J Neurosci. 2013 May 22;33(21):9028-38. doi: 10.1523/JNEUROSCI.1068-13.2013. J Neurosci. 2013. PMID: 23699514 Free PMC article. - Essential function of oncostatin m in nociceptive neurons of dorsal root ganglia.
Morikawa Y, Tamura S, Minehata K, Donovan PJ, Miyajima A, Senba E. Morikawa Y, et al. J Neurosci. 2004 Feb 25;24(8):1941-7. doi: 10.1523/JNEUROSCI.4975-03.2004. J Neurosci. 2004. PMID: 14985435 Free PMC article. - The Role of ATP Receptors in Pain Signaling.
Inoue K. Inoue K. Neurochem Res. 2022 Sep;47(9):2454-2468. doi: 10.1007/s11064-021-03516-6. Epub 2022 Jan 30. Neurochem Res. 2022. PMID: 35094248 Review. - Activation of P2X7 receptors in glial satellite cells reduces pain through downregulation of P2X3 receptors in nociceptive neurons.
Chen Y, Zhang X, Wang C, Li G, Gu Y, Huang LY. Chen Y, et al. Proc Natl Acad Sci U S A. 2008 Oct 28;105(43):16773-8. doi: 10.1073/pnas.0801793105. Epub 2008 Oct 22. Proc Natl Acad Sci U S A. 2008. PMID: 18946042 Free PMC article.
References
- Bradbury EJ, Burnstock G, McMahon SB. The expression of P2X3 purinoreceptors in sensory neurons: effects of axotomy and glial-derived neurotrophic factor. Mol Cell Neurosci. 1998;12:256–268. - PubMed
- Burgard EC, Niforatos W, van Biesen T, Lynch KJ, Touma E, Metzger RE, Kowaluk EA, Jarvis MF. P2X receptor-mediated ionic currents in dorsal root ganglion neurons. J Neurophysiol. 1999;82:1590–1598. - PubMed
Publication types
MeSH terms
Substances
LinkOut - more resources
Full Text Sources

