Characterization of the ECB binding complex responsible for the M/G(1)-specific transcription of CLN3 and SWI4 - PubMed (original) (raw)
Characterization of the ECB binding complex responsible for the M/G(1)-specific transcription of CLN3 and SWI4
Bernard Mai et al. Mol Cell Biol. 2002 Jan.
Abstract
The transcription factor Mcm1 is regulated by adjacent binding of a variety of different factors regulating the expression of cell-type-specific, cell cycle-specific, and metabolic genes. In this work, we investigate a new class of Mcm1-regulated promoters that are cell cycle regulated and peak in late M-early G(1) phase of the cell cycle via a promoter element referred to as an early cell cycle box (ECB). Gel filtration experiments indicate that the ECB-specific DNA binding complex is over 200 kDa in size and includes Mcm1 and at least one additional protein. Using DNase I footprinting in vitro, we have observed protection of the ECB elements from the CLN3, SWI4, CDC6, and CDC47 promoters, which includes protection of the 16-bp palindrome to which Mcm1 dimers are known to bind as well as protection of extended flanking sequences. These flanking sequences influence the stability and the variety of complexes that form on the ECB elements, and base substitutions in the protected flank affect transcriptional activity of the element. Chromatin immunoprecipitations show that Mcm1 binds in vivo to ECB elements throughout the cell cycle and that binding is sensitive to carbon source changes.
Figures
FIG. 1.
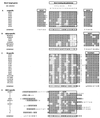
Binding sites of Mcm1-containing complexes. Compilation of Mcm1 binding sites in the promoters of four different classes of Mcm1 target genes based on previous studies (32, 44, 52, 54). The minimal Mcm1 binding site identified by site selection is shown at the top. Below are the in vivo binding sites for four different classes of Mcm1 target genes, and the 16-bp Mcm1 binding site is boxed. Positions fitting the consensus sequence for each group are shaded, and the consensus is shown below. Bases written in uppercase depict those which are more than 75% conserved; bases in lowercase show positions identical in at least half the target genes. W = A or T, K = G or T, M = A or C, Y = C or T, R = A or G, and a dot indicates any base. Boxes above each flanking homology indicate the proteins which are known to bind to those sites and confer regulatory specificity to the complex. The M/G1-specific genes are shown in section D, and all the sequences that are protected from DNase I cleavage (see Fig. 2 and 3) are shown in capital letters. Other potential ECB elements and a few other residues that are not protected from DNase I are shown in lowercase for purposes of comparison. Italic letters indicate that footprints were obtained only on the opposite strand to that shown. The sequence flanking the Mcm1 binding site in the M/G1-specific promoters is aligned to show a region of limited sequence homology that is protected from DNase I cleavage.
FIG. 2.
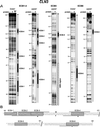
DNase I footprints of partially purified Mcm1 binding to ECB-containing regions of the CLN3 promoter. (A) Three different ECB-containing regions of the CLN3 promoter were end labeled on one DNA strand. Upper and lower strand-specific probes (indicated at top) were used in binding reactions containing saturating amounts of Mcm1, which was partially purified from yeast extracts. After a 10-min incubation at 25°C, the probe was digested with DNase I for a limited time and purified, and digestion products were resolved on a 8% denaturing gel. _Msp_I-cut pBR322 was labeled, run in parallel, and used as a size marker. The positions and numbers of base pairs of the marker fragments are indicated to the left of each panel. ECB sequences are indicated with boxes, colored black for the position of the core Mcm1-consensus binding sequence (CCN6GG) and gray for the A/T-rich 3-bp extensions. The hatched box depicts the region of the GREs. (B) Summary of the DNase I footprints. Positions of protected sequences (black lines) and DNase I-hypersensitive sites (black dots) are indicated in the sequence of the CLN3 promoter. Numbers represent the distance in nucleotides to the CLN3 ATG.
FIG. 3.
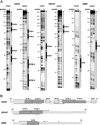
DNase I footprints of partially purified Mcm1 binding to ECB-containing regions of the CDC6, CDC47, and SWI4 promoters. (A) DNase I footprints were performed as described for Fig. 2 using strand-specific probes from the CDC6, CDC47, and SWI4 promoters. (B) Summary of the DNase I footprints. The 16-bp palindromes of each ECB are indicated with gray boxes. The positions of protected sequences (black lines) and DNase I-hypersensitive sites (black dots) are indicated in the promoter sequences.
FIG. 4.
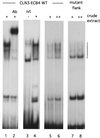
Protein/DNA complexes on ECB elements include Mcm1 and are influenced by sequences flanking the Mcm1 binding site. Shown are gel retardation assays of complexes that form on a 39-bp DNA fragment, including all the sequences around the fourth CLN3 ECB that are protected from DNase I cleavage (lanes 1 to 6) or those that form on the same palindromic site but lack the flanking sequences (lanes 7 and 8). Bar denotes Mcm1-specific complexes. All assays include 0.5 (+) or 1 (++) μl of crude cell extract, except lane 3, which shows the complexes formed with 1 μl of in vitro-translated Mcm1 (ivt). Polyclonal antiserum (Ab) directed against Mcm1 was added (0.5 μl) to lane 2.
FIG. 5.
Conserved bases in the protected flank influence the activity but not the cell cycle regulation of the SWI4 ECB element. (A) S1 protection (see Materials and Methods) was used to monitor CLN1, lacZ, and ACT1 mRNA levels through the cell cycle at 10-min intervals in α-factor-synchronized cells (7). The lacZ transcript is driven by a 39-bp fragment of the SWI4 promoter containing the wild-type ECB plus flanking sequence. (B) Transcript levels were quantified using a PhosphorImager and ImageQuant software (Molecular Dynamics, Sunnyvale, Calif.) The ratio of lacZ to the control RNA (ACT1) is plotted as a function of time over 2.5 cell cycles. The dashed line represents lacZ transcript driven by the wild-type (WT) ECB element, and circles show the transcript attained from a mutant ECB which has CG replacing the conserved GC in the flanking sequence. Both were integrated at the URA3 locus of W303 and were assayed for transcriptional activity on the same day with the same radioactive probes.
FIG. 6.
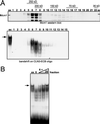
Gel filtration analysis of ECB binding complexes. (A) Clarified yeast crude extracts were subjected to gel filtration on a Sephacryl S200 column. Fractions were collected and assayed by Western blotting for the presence of Mcm1 (upper panel) and by gel retardation assays for ECB binding activity (lower panel). The first lane contains the extract (ex) loaded onto the column. Numbers indicate fractions, and gray bars depict the elution position of marker proteins run in parallel. The band shift assay below shows the only fractions in which DNA binding complexes were detected. The arrow marks the ECB-specific complex formed from crude yeast cell extracts. (B) Reconstitution of the ECB-specific complex. The _CLN3_-ECB oligonucleotide was incubated with crude extract, fraction 6 of the gel filtration, or a combination of fraction 6 and later fractions from the same column. Addition of increasing amounts of fraction 25 (three right lanes) restored the complex to a position comparable to that obtained with crude cell extracts, denoted by the arrow.
FIG. 7.
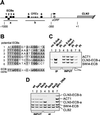
Mcm1 binds to ECB elements in vivo. (A) CLN3 promoter region showing the position of the ECB (solid boxes) elements and the GREs (gray boxes). The positions of the PCR products generated with the _CLN3_-ECB primer sets (_CLN3_-ECB-a and _CLN3_-ECB-b) are indicated. (B) Sequence alignment of the six potential ECB elements of the CLN3 promoter. Bases identical to the consensus (cons.) sequence are shaded. (C) Association of Mcm1 with _CLN3_-ECB- and _SWI4_-ECB-containing promoter regions in vivo. PCR products were separated on 6% native polyacrylamide gels run in 1× Tris-borate-EDTA and stained with ethidium bromide. PCR was performed on chromatin fragments isolated before (INPUT) and after (IP) immunoprecipitation with Mcm1 antibodies (αMcm1) or preimmune serum (PI) from whole-cell extract with or without (no X-link) prior formaldehyde cross-linking. The samples were prepared from BY2125 (W303a) grown in YEP glucose medium at 30°C. Lanes 7 and 8 show PCRs performed on input DNAs taken in threefold serial dilutions. (D) Association of Mcm1 with _CLN3_-ECB, _SWI4_-ECB, and CLB2 promoter regions in the wild type (BY2125) (lanes 1 and 4), _cln3ecb_-5 (BY2278) (lanes 2 and 5), and _cln3ecb_-6 (BY2690) (lanes 3 and 6) mutant strains. Cells were grown in YEP galactose at 30°C, and CHIPs were performed using Mcm1-specific antibodies. Lane 7 shows PCR products obtained with yeast genomic DNA as the template. _CLN3_-ECB-a probe includes the first four potential ECB elements, and _CLN3_-ECB-b includes the fifth and sixth such sites.
FIG. 8.
Chromatin association of Mcm1 through the cell cycle. Wild-type cells grown in glucose were synchronized using α-factor. After 90 min, α-factor was removed by filtration (7) and cells were released into fresh media. Samples were taken at the end of the arrest (lane αF) and every 10 min for 110 min after the release. CHIPs were performed for each sample and assayed for the presence of ACT1, CDC6, CLN3, and SWI4 promoter sequences. The top half shows PCR products obtained from chromatin extracts before immunoprecipitation with Mcm1 antibody (INPUT). The bottom half shows PCR products obtained with immunoprecipitated DNA (IP).
FIG. 9.
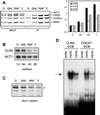
Mcm1-ECB interaction in different carbon sources. (A) Wild-type cells were grown in YEP medium supplemented with 2% glucose (D), galactose (gal), raffinose (raf), or glycerol (Y), and CHIP analysis was performed as described for Fig. 7. At right is shown the data quantified as ratios of the amount immunoprecipitated (IP) over the input and normalized to the value obtained in the glucose-grown cells. (B) Northern blot analysis of cultures used for the CHIP experiments. The blot was sequentially probed for CLN3 and ACT1 and quantified. The ratio of counts in CLN3 over ACT1 is shown below each lane. Because the ACT1 transcript is also lower in cells grown in the poor carbon sources, this value is an underestimate of the reduction of CLN3 mRNA under these conditions. (C) Western analysis detecting Mcm1 protein (asterisk) from extracts of cells grown in the carbon sources indicated. (D) Gel retardation assays using crude extracts from wild-type cells grown in YEP medium supplemented with 2% glucose (YEPD) or 2% glycerol (YEPG) and ECB-containing probes from the CLN3 or CDC47 promoter. The arrow depicts the position of the Mcm1-specific protein-DNA complex, and the first and fourth lanes show the migration of probe alone (probe).
Similar articles
- A novel Mcm1-dependent element in the SWI4, CLN3, CDC6, and CDC47 promoters activates M/G1-specific transcription.
McInerny CJ, Partridge JF, Mikesell GE, Creemer DP, Breeden LL. McInerny CJ, et al. Genes Dev. 1997 May 15;11(10):1277-88. doi: 10.1101/gad.11.10.1277. Genes Dev. 1997. PMID: 9171372 - Bck2 acts through the MADS box protein Mcm1 to activate cell-cycle-regulated genes in budding yeast.
Bastajian N, Friesen H, Andrews BJ. Bastajian N, et al. PLoS Genet. 2013 May;9(5):e1003507. doi: 10.1371/journal.pgen.1003507. Epub 2013 May 9. PLoS Genet. 2013. PMID: 23675312 Free PMC article. - Mcm1 is required to coordinate G2-specific transcription in Saccharomyces cerevisiae.
Althoefer H, Schleiffer A, Wassmann K, Nordheim A, Ammerer G. Althoefer H, et al. Mol Cell Biol. 1995 Nov;15(11):5917-28. doi: 10.1128/MCB.15.11.5917. Mol Cell Biol. 1995. PMID: 7565744 Free PMC article. - Early cell cycle box-mediated transcription of CLN3 and SWI4 contributes to the proper timing of the G(1)-to-S transition in budding yeast.
MacKay VL, Mai B, Waters L, Breeden LL. MacKay VL, et al. Mol Cell Biol. 2001 Jul;21(13):4140-8. doi: 10.1128/MCB.21.13.4140-4148.2001. Mol Cell Biol. 2001. PMID: 11390643 Free PMC article.
Cited by
- Ash1 and Tup1 dependent repression of the Saccharomyces cerevisiae HO promoter requires activator-dependent nucleosome eviction.
Parnell EJ, Parnell TJ, Yan C, Bai L, Stillman DJ. Parnell EJ, et al. PLoS Genet. 2020 Dec 31;16(12):e1009133. doi: 10.1371/journal.pgen.1009133. eCollection 2020 Dec. PLoS Genet. 2020. PMID: 33382702 Free PMC article. - Differential Scaling of Gene Expression with Cell Size May Explain Size Control in Budding Yeast.
Chen Y, Zhao G, Zahumensky J, Honey S, Futcher B. Chen Y, et al. Mol Cell. 2020 Apr 16;78(2):359-370.e6. doi: 10.1016/j.molcel.2020.03.012. Epub 2020 Apr 3. Mol Cell. 2020. PMID: 32246903 Free PMC article. - Inference of gene regulation functions from dynamic transcriptome data.
Hillenbrand P, Maier KC, Cramer P, Gerland U. Hillenbrand P, et al. Elife. 2016 Sep 21;5:e12188. doi: 10.7554/eLife.12188. Elife. 2016. PMID: 27652904 Free PMC article. - Regulation of Ace2-dependent genes requires components of the PBF complex in Schizosaccharomyces pombe.
Suárez MB, Alonso-Nuñez ML, del Rey F, McInerny CJ, Vázquez de Aldana CR. Suárez MB, et al. Cell Cycle. 2015;14(19):3124-37. doi: 10.1080/15384101.2015.1078035. Epub 2015 Aug 3. Cell Cycle. 2015. PMID: 26237280 Free PMC article. - Topology and control of the cell-cycle-regulated transcriptional circuitry.
Haase SB, Wittenberg C. Haase SB, et al. Genetics. 2014 Jan;196(1):65-90. doi: 10.1534/genetics.113.152595. Genetics. 2014. PMID: 24395825 Free PMC article. Review.
References
- Ammerer, G. 1990. Identification, purification, and cloning of a polypeptide (PRTF/GRM) that binds to mating-specific promoter elements in yeast. Genes Dev. 4:299–312. - PubMed
- Anderson, M. S., and J. M. Lopes. 1996. Carbon source regulation of PIS1 gene expression in Saccharomyces cerevisiae involves the MCM1 gene and the two-component regulatory gene, SLN1. J. Biol. Chem. 271:26596–26601. - PubMed
- Breeden, L., and G. Mikesell. 1991. Cell cycle-specific expression of the SWI4 transcription factor is required for the cell cycle regulation of HO transcription. Genes Dev. 5:1183–1190. - PubMed
Publication types
MeSH terms
Substances
LinkOut - more resources
Full Text Sources
Molecular Biology Databases
