Arabidopsis gp91phox homologues AtrbohD and AtrbohF are required for accumulation of reactive oxygen intermediates in the plant defense response - PubMed (original) (raw)
Arabidopsis gp91phox homologues AtrbohD and AtrbohF are required for accumulation of reactive oxygen intermediates in the plant defense response
Miguel Angel Torres et al. Proc Natl Acad Sci U S A. 2002.
Abstract
Reactive oxygen intermediates (ROI) are strongly associated with plant defense responses. The origin of these ROI has been controversial. Arabidopsis respiratory burst oxidase homologues (rboh genes) have been proposed to play a role in ROI generation. We analyzed lines carrying dSpm insertions in the highly expressed AtrbohD and AtrbohF genes. Both are required for full ROI production observed during incompatible interactions with the bacterial pathogen Pseudomonas syringae pv. tomato DC3000(avrRpm1) and the oomycete parasite Peronospora parasitica. We also observed reduced cell death, visualized by trypan blue stain and reduced electrolyte leakage, in the Atrboh mutants after DC3000(avrRpm1) inoculation. However, enhanced cell death is observed after infection of mutant lines with P. parasitica. Paradoxically, although atrbohD mutation eliminated the majority of total ROI production, atrbohF mutation exhibited the strongest effect on cell death.
Figures
Figure 1
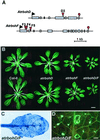
Arabidopsis atrbohD and atrbohF mutants. (A) Schematic representation of the transposon insertions in the Atrboh D and F genes. Boxes represent the exons of the genes, and red triangles mark the_dSpm_ transposon insertions. (B) Representative 4-week-old rosettes. (C) Trypan blue staining of an atrbohD/F double mutant leaf, displaying spontaneous necrosis. (D) Detail of an_atrbohD/F_ leaf stained with aniline blue to show callose deposition. Note that infection experiments are performed on young plants that do not exhibit ectopic cell death. [Bar = 1 cm (B) and 1 mm (D).]
Figure 2
Reduced ROI accumulation and cell death in the_atrboh_ mutants after inoculation of avirulent bacteria. (A) In situ detection of peroxides by using DAB staining on wt Col-0 and atrboh mutant leaves 5 h postinoculation with DC3000(avrRpm1) at 2.5 × 10⁷ cfu/ml. (B) Quantitative analysis of DAB on leaves 6 h postinoculation with DC3000(avrRpm1) at 2.5 × 10⁷ cfu/ml, DC3000 (same inoculum concentration), or 10 mM MgCl2. (Bars = SD.) (C) Detail of leaves stained with DAB 5 h postinoculation with DC3000(avrRpm1) at 2.5 × 10⁷ cfu/ml. Genotypes are labeled at the top, left to right: Col-0, atrbohD, atrbohF, and atrbohD/F. (D) Detail of leaves stained with trypan blue 5 h postinoculation with DC3000(avrRpm1) at 2.5 × 10⁷ cfu/ml. (E) Detail of leaves stained with trypan blue 12 h postinoculation with lower dose of DC3000(avrRpm1), 106 cfu/ml. (Bar = 25 μm.) All images in_C_–E have the same magnification.
Figure 3
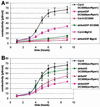
Reduced electrolyte leakage in atrboh mutants after inoculation with avirulent bacteria. (A) Conductivity (μS/cm) of solution containing leaf discs from either wt Col-0 or atrbohD/F mutant inoculated with avirulent bacteria DC3000(avrRpm1) at 107 cfu/ml, virulent bacteria DC3000 at 107 cfu/ml, or 10 mM MgCl2. (B) Detailed differences in conductivity between Col-0 and the atrboh mutants during the incompatible interaction DC3000(avrRpm1) at 107 cfu/ml. Each value represents the mean and SD of three replicates (compatible interaction and MgCl2) or four replicates (incompatible interactions) per experiment. The experiment was repeated three times with similar results.
Figure 4
Reduced peroxide accumulation and enhanced cell death in the_atrboh_ mutants after inoculation with Pp isolate Emco5. (A) DAB staining of leaves 3 days after inoculation with Pp isolate Emco5. Arrows indicate HR sites in atrbohD/F. (B) Trypan blue stain of leaves from the same experiment 3 days after inoculation with_Pp_ isolate Emco5. The experiment was repeated four times; ≈10 leaves per genotype per experiment analyzed. (Bar = 50 μm for all.)
Figure 5
Reduced sporangiophore formation in the atrboh mutants. The histogram represents the percentage of first leaves of seedlings (genotypes at bottom) that display >20, 11–20, 1–10, or 0 sporangiophores 7 days postinoculation with Pp isolate Emco5. The data are the mean and SD from three different experiments representing more than 200 total leaves evaluated for each genotype.
Similar articles
- Functional interplay between Arabidopsis NADPH oxidases and heterotrimeric G protein.
Torres MA, Morales J, Sánchez-Rodríguez C, Molina A, Dangl JL. Torres MA, et al. Mol Plant Microbe Interact. 2013 Jun;26(6):686-94. doi: 10.1094/MPMI-10-12-0236-R. Mol Plant Microbe Interact. 2013. PMID: 23441575 - Glycolate oxidase is an alternative source for H2O2 production during plant defense responses and functions independently from NADPH oxidase.
Rojas C, Mysore KS. Rojas C, et al. Plant Signal Behav. 2012 Jul;7(7):752-5. doi: 10.4161/psb.20429. Epub 2012 Jul 1. Plant Signal Behav. 2012. PMID: 22751316 Free PMC article. - Characterization of a novel, defense-related Arabidopsis mutant, cir1, isolated by luciferase imaging.
Murray SL, Thomson C, Chini A, Read ND, Loake GJ. Murray SL, et al. Mol Plant Microbe Interact. 2002 Jun;15(6):557-66. doi: 10.1094/MPMI.2002.15.6.557. Mol Plant Microbe Interact. 2002. PMID: 12059104 - Regulation of plant reactive oxygen species (ROS) in stress responses: learning from AtRBOHD.
Liu Y, He C. Liu Y, et al. Plant Cell Rep. 2016 May;35(5):995-1007. doi: 10.1007/s00299-016-1950-x. Epub 2016 Feb 16. Plant Cell Rep. 2016. PMID: 26883222 Review.
Cited by
- Rice NLR protein XinN1, induced by a pattern recognition receptor XA21, confers enhanced resistance to bacterial blight.
Moon H, Jeong AR, Park CJ. Moon H, et al. Plant Cell Rep. 2024 Feb 20;43(3):72. doi: 10.1007/s00299-024-03156-4. Plant Cell Rep. 2024. PMID: 38376569 - Mutant Allele-Specific Uncoupling of PENETRATION3 Functions Reveals Engagement of the ATP-Binding Cassette Transporter in Distinct Tryptophan Metabolic Pathways.
Lu X, Dittgen J, Piślewska-Bednarek M, Molina A, Schneider B, Svatoš A, Doubský J, Schneeberger K, Weigel D, Bednarek P, Schulze-Lefert P. Lu X, et al. Plant Physiol. 2015 Jul;168(3):814-27. doi: 10.1104/pp.15.00182. Epub 2015 May 28. Plant Physiol. 2015. PMID: 26023163 Free PMC article. - Precision transcriptomics of viral foci reveals the spatial regulation of immune-signaling genes and identifies RBOHD as an important player in the incompatible interaction between potato virus Y and potato.
Lukan T, Pompe-Novak M, Baebler Š, Tušek-Žnidarič M, Kladnik A, Križnik M, Blejec A, Zagorščak M, Stare K, Dušak B, Coll A, Pollmann S, Morgiewicz K, Hennig J, Gruden K. Lukan T, et al. Plant J. 2020 Nov;104(3):645-661. doi: 10.1111/tpj.14953. Epub 2020 Sep 1. Plant J. 2020. PMID: 32772469 Free PMC article. - Inhibition of multiple defense responsive pathways by CaWRKY70 transcription factor promotes susceptibility in chickpea under Fusarium oxysporum stress condition.
Chakraborty J, Sen S, Ghosh P, Jain A, Das S. Chakraborty J, et al. BMC Plant Biol. 2020 Jul 6;20(1):319. doi: 10.1186/s12870-020-02527-9. BMC Plant Biol. 2020. PMID: 32631232 Free PMC article. - Brassinosteroids play a critical role in the regulation of pesticide metabolism in crop plants.
Zhou Y, Xia X, Yu G, Wang J, Wu J, Wang M, Yang Y, Shi K, Yu Y, Chen Z, Gan J, Yu J. Zhou Y, et al. Sci Rep. 2015 Mar 12;5:9018. doi: 10.1038/srep09018. Sci Rep. 2015. PMID: 25761674 Free PMC article.
References
- Doke N. Physiol Plant Pathol. 1983;23:359–367.
- Levine A, Tenhaken R, Dixon R, Lamb C J. Cell. 1994;79:583–593. - PubMed
- Nürnberger T, Nennstiel D, Jabs T, Sacks W R, Hahlbrock K, Scheel D. Cell. 1994;78:449–460. - PubMed
- Bradley D, Kjellbom P, Lamb C. Cell. 1992;70:21–30. - PubMed
Publication types
MeSH terms
Substances
LinkOut - more resources
Full Text Sources
Other Literature Sources
Molecular Biology Databases
Miscellaneous


