Genome-scale evolution: reconstructing gene orders in the ancestral species - PubMed (original) (raw)
Genome-scale evolution: reconstructing gene orders in the ancestral species
Guillaume Bourque et al. Genome Res. 2002 Jan.
Abstract
Recent progress in genome-scale sequencing and comparative mapping raises new challenges in studies of genome rearrangements. Although the pairwise genome rearrangement problem is well-studied, algorithms for reconstructing rearrangement scenarios for multiple species are in great need. The previous approaches to multiple genome rearrangement problem were largely based on the breakpoint distance rather than on a more biologically accurate rearrangement (reversal) distance. Another shortcoming of the existing software tools is their inability to analyze rearrangements (inversions, translocations, fusions, and fissions) of multichromosomal genomes. This paper proposes a new multiple genome rearrangement algorithm that is based on the rearrangement (rather than breakpoint) distance and that is applicable to both unichromosomal and multichromosomal genomes. We further apply this algorithm for genome-scale phylogenetic tree reconstruction and deriving ancestral gene orders. In particular, our analysis suggests a new improved rearrangement scenario for a very difficult Campanulaceae cpDNA dataset and a putative rearrangement scenario for human, mouse and cat genomes.
Figures
Figure 1
Reversal distance, d(πγ), versus actual number of reversals performed to transform π into γ, where γ is a genome/permutation that evolved from the identity permutation π = 1,2, … ,100 by k random reversals. The simulations were repeated 10 times for every k. We compute the average difference between the reversal distance and the actual number of reversals performed (k).
Figure 2
Comparison of MGR-MEDIAN and GRAPPA (three genomes equidistant from the ancestor). The genomes _G_1, G_2, G_3 are obtained by k reversals each from the ancestral identity permutation 1 2 … n (n = 30 and n = 100). The simulations were repeated 10 times for every ratio #reversals/#markers = 3_k/n. (a) and (b) show the average difference between the number of reversals on the tree recovered by the algorithm and the number of reversals on the actual tree (equal to 3_k). (c) and (d) show the average reversal distance between the solution recovered and the actual ancestor.
Figure 3
Comparison of MGR-MEDIAN and GRAPPA (three genomes nonequidistant from the ancestor). The genomes G_1, G_2, and G_3 are obtained by k, k, and 2_k reversals, respectively, each from the ancestral identity permutation 1 2 … n (n = 30 and n = 100). The simulations were repeated 10 times for every ratio #reversals/#markers = 4_k/n. (a) and (b) show the average difference between the number of reversals on the tree recovered by the algorithm and the number of reversals on the actual tree (equal to 4_k). (c) and (d) show the average reversal distance between the solution recovered and the actual ancestor.
Figure 4
Comparison of MGR and GRAPPA (four genomes). We start from an unrooted tree with four leaves and select one of the two internal nodes to be the identity permutation 1 2 … n (n = 30 and n = 100). We then perform k reversals on each branch of the tree to obtain the genomes _G_1, _G_2, G_3, and G_4 as the four leaves of the tree. The simulations were repeated 10 times for every ratio #reversals/#markers = 5_k/n. (a) and (b) show the average difference between the number of reversals on the tree recovered by the algorithm and the number of reversals on the actual tree (equal to 5_k). (c) and (d) show the average reversal distance between the best (i.e., closest) internal node in the solution recovered and the identity permutation.
Figure 5
Comparison of MGR and GRAPPA (m genomes each with 30 markers). The genomes _G_1,_G_2, … ,G m correspond to a subset of leaves from a complete unrooted binary tree on which we have performed k reversals on each branch. The simulations were repeated 10 times for every m. (a) and (b) show the average difference between the number of reversals on the tree recovered by the algorithm and the number of reversals on the actual tree when k = 2 and k = 3, respectively.
Figure 6
Herpes simplex virus (HSV), Epstein-Barr virus (EBV), and Cytomegalovirus (CMV) gene orders (Hannenhalli et al. 1995) as well as the ancestral gene order (A) and optimal evolutionary scenario recovered by MGR-MEDIAN.
Figure 7
Human, sea urchin, and fruit fly mitochondrial gene order taken from Sankoff et al. (1996). A is the ancestral gene order suggested by MGR-MEDIAN.
Figure 8
Phylogeny of 11 metazoan genomes reconstructed by MGR. The gene order data is taken from the MGA Source Guide compiled by Jeffrey L. Boore. The genomes come from 6 major metazoan groupings: nematodes (NEM), annelids (ANN), mollusks (MOL), arthropods (ART), echinoderms (ECH), and chordates (CHO). Numbers show the number of reversals.
Figure 9
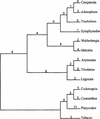
Phylogeny of the Campanulaceae cpDNA dataset as reconstructed by MGR. Numbers show the number of reversals.
Figure 10
Performance of MGR-MC (three multichromosomal genomes equidistant from the ancestor). The ancestral genomes are obtained from the identity permutation 1 2 … n (n = 30 and n = 100) by inserting b chromosomes breaks (b = 2 when n = 30 and b = 9 when n = 100). The genomes _G_1, G_2, and G_3 are obtained by k rearrangements each from the ancestral genomes. Each rearrangement is a reversal/translocation with probability p and a fusion/fission with probability 1 − p. The simulations were repeated 10 times for every ratio #rearrangements/#markers = 3_k/n. We compute the average score difference, which is the difference between the number of rearrangements on the tree recovered by the algorithm and the actual number of rearrangements (equal to 3_k). We also compute the average distance of solution between the solution recovered and the actual ancestor.
Figure 11
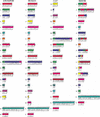
Ancestral median for human, mouse, and cat genomes found by MGR-MC. We used the gene order of 114 markers spread over the chromosomes in all three species. The numbers above the chromosomes correspond to these 114 markers, and the numbering is such that the human genome corresponds to the identity permutation broken into 20 pieces. The names below the chromosomes correspond to the name of the markers. We attribute a color to each human chromosome. The color of any marker (in any genome) indicates the human chromosome on which the homolog of this marker lies. Each marker segment is traversed by a diagonal line. These diagonal lines are such that the human chromosomes are traversed from top left to bottom right and are designed to provide visual help to identify where rearrangements occurred. For example, for chromosome X, the gene order of the ancestor coincides with the cat gene order and only differs by one segment consisting of genes 108 and 109 (break in the diagonal line) from the human gene order. The mouse X chromosome is broken into 7 segments compared to the ancestor (shown by seven broken segments of the diagonal line).
Similar articles
- GRIMM: genome rearrangements web server.
Tesler G. Tesler G. Bioinformatics. 2002 Mar;18(3):492-3. doi: 10.1093/bioinformatics/18.3.492. Bioinformatics. 2002. PMID: 11934753 - Multichromosomal median and halving problems under different genomic distances.
Tannier E, Zheng C, Sankoff D. Tannier E, et al. BMC Bioinformatics. 2009 Apr 22;10:120. doi: 10.1186/1471-2105-10-120. BMC Bioinformatics. 2009. PMID: 19386099 Free PMC article. - Reconstructing the genomic architecture of mammalian ancestors using multispecies comparative maps.
Murphy WJ, Bourque G, Tesler G, Pevzner P, O'Brien SJ. Murphy WJ, et al. Hum Genomics. 2003 Nov;1(1):30-40. doi: 10.1186/1479-7364-1-1-30. Hum Genomics. 2003. PMID: 15601531 Free PMC article. - Genome Rearrangement Analysis : Cut and Join Genome Rearrangements and Gene Cluster Preserving Approaches.
Hartmann T, Middendorf M, Bernt M. Hartmann T, et al. Methods Mol Biol. 2024;2802:215-245. doi: 10.1007/978-1-0716-3838-5_9. Methods Mol Biol. 2024. PMID: 38819562 Review. - Analysis of gene order evolution beyond single-copy genes.
El-Mabrouk N, Sankoff D. El-Mabrouk N, et al. Methods Mol Biol. 2012;855:397-429. doi: 10.1007/978-1-61779-582-4_15. Methods Mol Biol. 2012. PMID: 22407718 Review.
Cited by
- A flexible ancestral genome reconstruction method based on gapped adjacencies.
Gagnon Y, Blanchette M, El-Mabrouk N. Gagnon Y, et al. BMC Bioinformatics. 2012;13 Suppl 19(Suppl 19):S4. doi: 10.1186/1471-2105-13-S19-S4. Epub 2012 Dec 19. BMC Bioinformatics. 2012. PMID: 23281872 Free PMC article. - Genome evolution in the primary endosymbiont of whiteflies sheds light on their divergence.
Santos-Garcia D, Vargas-Chavez C, Moya A, Latorre A, Silva FJ. Santos-Garcia D, et al. Genome Biol Evol. 2015 Feb 25;7(3):873-88. doi: 10.1093/gbe/evv038. Genome Biol Evol. 2015. PMID: 25716826 Free PMC article. - Chloroplast DNA rearrangements in Campanulaceae: phylogenetic utility of highly rearranged genomes.
Cosner ME, Raubeson LA, Jansen RK. Cosner ME, et al. BMC Evol Biol. 2004 Aug 23;4:27. doi: 10.1186/1471-2148-4-27. BMC Evol Biol. 2004. PMID: 15324459 Free PMC article. - Web-based resources for comparative genomics.
Gu X, Su Z. Gu X, et al. Hum Genomics. 2005 Sep;2(3):187-90. doi: 10.1186/1479-7364-2-3-187. Hum Genomics. 2005. PMID: 16197736 Free PMC article. Review. - Extensive gene order rearrangement in the mitochondrial genome of the centipede Scutigera coleoptrata.
Negrisolo E, Minelli A, Valle G. Negrisolo E, et al. J Mol Evol. 2004 Apr;58(4):413-23. doi: 10.1007/s00239-003-2563-x. J Mol Evol. 2004. PMID: 15114420
References
- Bafna V, Pevzner P. Sorting by reversals: Genome rearrangements in plant organelles and evolutionary history of X chromosome. Mol Biol Evol. 1995;12:239–246.
- Bergeron A. Proceedings of the Twelfth Annual Symposium on Combinatorial Pattern Matching. 2089 of Lecture Notes in Computer Science. 2001. A very elementary presentation of the Hannenhall-Pevzner theory; pp. 106–117. . Jerusalem, Israel. Springer-Verlag, New York.
- Berman P, Hannenhalli S. Combinatorial Pattern Matching. Seventh Annual Symposium. Vol. 1075. 1996. Fast sorting by reversal. of Lecture Notes in Computer Science, pp. 168–185. Springer, New York.
- Blanchette M, Bourque G, Sankoff D. Breakpoint phylogenies. In: Miyano S, Takagi T, editors. Genome Informatics Workshop (GIW 1997) Tokyo: University Academy Press; 1997. pp. 25–34. - PubMed
- Blanchette M, Kunisawa T, Sankoff D. Gene order breakpoint evidence in animal mitochondrial phylogeny. J Mol Evol. 1999;49:193–203. - PubMed
Publication types
MeSH terms
LinkOut - more resources
Full Text Sources
Other Literature Sources
Miscellaneous


