Oligosaccharides of Hyaluronan activate dendritic cells via toll-like receptor 4 - PubMed (original) (raw)
Oligosaccharides of Hyaluronan activate dendritic cells via toll-like receptor 4
Christian Termeer et al. J Exp Med. 2002.
Abstract
Low molecular weight fragmentation products of the polysaccharide of Hyaluronic acid (sHA) produced during inflammation have been shown to be potent activators of immunocompetent cells such as dendritic cells (DCs) and macrophages. Here we report that sHA induces maturation of DCs via the Toll-like receptor (TLR)-4, a receptor complex associated with innate immunity and host defense against bacterial infection. Bone marrow-derived DCs from C3H/HeJ and C57BL/10ScCr mice carrying mutant TLR-4 alleles were nonresponsive to sHA-induced phenotypic and functional maturation. Conversely, DCs from TLR-2-deficient mice were still susceptible to sHA. In accordance, addition of an anti-TLR-4 mAb to human monocyte-derived DCs blocked sHA-induced tumor necrosis factor alpha production. Western blot analysis revealed that sHA treatment resulted in distinct phosphorylation of p38/p42/44 MAP-kinases and nuclear translocation of nuclear factor (NF)-kappa B, all components of the TLR-4 signaling pathway. Blockade of this pathway by specific inhibitors completely abrogated the sHA-induced DC maturation. Finally, intravenous injection of sHA-induced DC emigration from the skin and their phenotypic and functional maturation in the spleen, again depending on the expression of TLR-4. In conclusion, this is the first report that polysaccharide degradation products of the extracellular matrix produced during inflammation might serve as an endogenous ligand for the TLR-4 complex on DCs.
Figures
Figure 1.
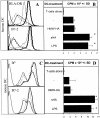
sHA induces phenotypic and functional maturation of human and mouse DCs. Human monocyte–derived day 4 DCs (A and B) or murine day 6 bone marrow–derived DCs (C and D) were used after 48-h incubation with 20 μg/ml sHA (bold line), 50 μg/ml HMW-HA (solid line), 100 ng/ml LPS (dotted line), or left untreated (broken line). (A and C) DCs were stained with mAbs directed against MHC class II (top) or B7–2 (CD86; lower) and analyzed by flow cytometry. A representative of five independent experiments is shown. (B and D) The cells were coincubated for 4 d with 105 alloreactive T cells at a DC:TC ratio of 1:20. T cell proliferation was determined on day 5 by addition of 1 μCi of 3[H]thymidine for the final 18 h. Results are shown in counts per minute (CPM) ± SD of triplicate wells. P > 0.001 compared with untreated DCs (−). A representative of four independent experiments is shown.
Figure 2.
Analysis of TNF-α production by DCs in response to sHA stimulation. (A and B) Human monocyte–derived day 4 DCs were treated with 25 μg/ml sHA or 100 ng/ml LPS for the indicated times. After stimulation, (A) cells were harvested and RNA was prepared for TNF-α–specific RT-PCR, and (B) cell-free supernatants were collected and assayed by TNF-α ELISA. The dotted line shows the response to LPS, the solid line the response to sHA. Data represent the mean TNF-α release of triplicate values; pg/mg total protein ± SD. (C) DCs were incubated for 24 h with the indicated concentrations of sHA or 100 ng/ml LPS and cell-free supernatants were collected and assayed by TNF-α ELISA as detailed above.
Figure 3.
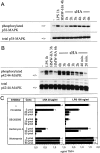
sHA-mediated DC maturation requires p38-MAPK and P42/44-MAPK phosphorylation. (A and B) Human monocyte–derived day 4 DCs were treated with 50 μg/ml sHA, 100 μg/ml HMW-HA, or 100 ng/ml LPS for the times indicated. Western immunoblotting was performed using mAbs specific for the phosphorylated kinase (top) or total kinase content of the cells (bottom). Shown are blots for (A) p38 MAPK and (B) p42/44 MAPK. (C) Supernatants of DCs stimulated with 30 μg/ml sHA or 1 ng/ml LPS in the presence of the indicated concentrations of the MAPK inhibitors PD98059 (p38), SB 203580 (p42/44), Herbimycin A (src-like tyrosine kinases), or Wortmannin (PI3-kinase) were harvested after 7 h and screened for their TNF-α content by ELISA. Data represent the mean TNF-α release of triplicate wells; pg/mg total protein ± SD.
Figure 4.
The sHA-induced DC maturation is NF-κB dependent. (A) Nuclear extracts were prepared from DCs treated with either HMW-HA (30 μg/ml), sHA (30 μg/ml), LPS (10 ng/ml), or left untreated. A total of 10 μg of protein from each nuclear extract was analyzed for NF-κB activity by EMSA. The arrow indicates specific NF-κB bands. (B) Supernatants of DCs stimulated with 30 μg/ml sHA (white bars) or 10 ng/ml LPS (black bars) in the presence of the indicated concentrations of the NF-κB inhibitor CAPE were harvested after 7 h and screened for their TNF-α content by ELISA. Data represent the mean TNF-α release of triplicate wells; pg/mg total protein ± SD.
Figure 5.
TLR-4 mediates TNF-α production of sHA-stimulated human DCs and is downregulated after activation. (A) Anti–TLR-4 antibodies inhibit TNF-α production by DCs in response to sHA (left) and LPS (right). DCs were either preincubated for 30 or 60 min with 10 or 20 μg/ml of the anti–TLR-4 mAb HTA 125 as indicated, a matched IgG-isotype control (black circles) or left untreated (white circles). The cells were then stimulated with 30 μg/ml sHA (left) or 100 ng/ml LPS (right) for the times (h) indicated. Supernatants were harvested and screened for their TNF-α content by ELISA as described previously. Data represent the mean TNF-α release of triplicate wells; ng/mg total protein. (B) Total mRNA from human DCs treated either with 100 ng/ml LPS or 30 μg/ml sHA for the indicated times was analyzed by RT-PCR. The top shows TLR-2, the middle TLR-4 regulation, the bottom shows β-actin control. (C) DCs were analyzed by FACS® for their surface-expression of TLR-4 on: untreated control DCs (solid line), HMW-HA–treated DCs (30 μg/ml; dashed line), sHA-treated DCs (30 μg/ml; bold line), and LPS-treated DC (1 ng/ml; dotted line). Dot-dash line: DCs stained with secondary antibody alone. A representative of three independent experiments is shown.
Figure 6.
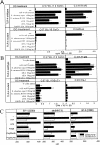
DCs derived from TLR-4–deficient mice are not sensitive to sHA stimulation. (A) Bone marrow–derived DCs were obtained from either C3H/HeN (wild-type) and C3H/HeJ (TLR-4 mutant) or C57BL/10ScSn (wild-type) and C57BL/10ScCr (TLR-4 mutant). On day 6 of culture the DCs were either incubated with 100 ng/ml of bacterial cell wall lysates containing LPS and other substances such as lipoprotein, or 100 ng/ml highly purified LPS from Salmonella abortus equi or Salmonella minessota strain R595 as positive and negative controls. Alternatively, 10 or 50 μg/ml sHA or 100 μg/ml HMW-HA were added. After 48 h of treatment the cell free supernatants were screened for their TNF-α content by ELISA. Data represent the mean TNF-α release of triplicate wells; pg/mg total protein ± SD. (B) DCs were treated for 48 h with the same substances described in A, washed, and coincubated for 4 d with 105 alloreactive T cells at a DC/TC ratio of 1:20. T cell proliferation was determined on day 5 by addition of 1 μCi of 3[H]thymidine for the final 18 h. Results are shown in counts per minute (CPM) ± SD of triplicate wells. (C) Day 6 bone marrow–derived DCs of either C57BL/10Sn (black bars) or C57BL/10Cr (white bars) were incubated for 24 h with 30 μg/ml sHA or 100 ng/ml LPS and/or pretreated with 10 mg/ml polymyxin B (polyB) 1 h before stimulation. After 24 h of incubation DCs were stained for Iab, B7–1, and B7–2 expression and analyzed by flow cytometry. Results are shown a mean fluorescence intensities (MFI).
Figure 7.
sHA-mediated DC stimulation is not dependent on TLR-2 expression. Day 6 bone marrow–derived DCs from C57BL/6 or C57BL/6TLR-2−/− were incubated for 48 h with the indicated concentrations of highly purified LPS from Salmonella abortus equi or sHA. (A) The cell free supernatants were screened for their TNF-α content by ELISA. Data represent the mean TNF-α release of triplicate wells; pg/mg total protein ± SD. (B) DCs were treated for 48 h with the same substances described in A, washed, and coincubated for 4 d with 105 alloreactive T cells at a DC/TC ratio of 1:20. T cell proliferation was determined on day 5 by addition of 1 μCi of 3[H]thymidine for the final 18 h. Results are shown in counts per minute (CPM) ± SD of triplicate wells.
Figure 8.
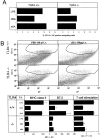
In vivo relevance of the sHA-induced DC stimulation. (A) Full thickness skin was obtained from the outer epidermal sheet of the ears of C57BL/10ScSn wild-type (TLR+/+) and TLR-4−/− C57BL/10Cr mice at three animals per group. Ear sheets were floated on supplemented RPMI 1640 with or without addition of 30 μg/ml sHA or 100 ng/ml LPS. After 24 h, cells that had migrated into the culture medium were collected and double stained for CD11c and IaB expression. Large, highly CD11c and IaB-positive cells were considered as DCs and the percentage was calculated by flow cytometry. A representative of two independent experiments is shown. (B) 100 μg/animal sHA or 100 μl PBS was injected intravenous into the tail vein of C57BL/10ScSn wild-type (TLR+/+) and TLR-4 −/− C57BL/10Cr mice at three animals per group. The mice were killed after 12 h and large, highly CD11c-positive cells in the spleens were analyzed for their IaB and B7–2 expression by flow cytometry. Results are shown as mean fluorescence intensities (MFI) in the marked gates ± SD. Further, DCs were isolated from spleen cells and 5 × 10³ DCs were restimulated for 4 d with 105 allogenic T cells from BALB/c mice. T cell proliferation was determined on day 4 by addition of 1 μCi of 3[H]thymidine for the final 18 h. Results are shown as counts per minute (CPM) ± SD of triplicate wells. A representative of two independent experiments is shown.
Similar articles
- Endotoxin-induced maturation of MyD88-deficient dendritic cells.
Kaisho T, Takeuchi O, Kawai T, Hoshino K, Akira S. Kaisho T, et al. J Immunol. 2001 May 1;166(9):5688-94. doi: 10.4049/jimmunol.166.9.5688. J Immunol. 2001. PMID: 11313410 - A Toll-like receptor 2 ligand stimulates Th2 responses in vivo, via induction of extracellular signal-regulated kinase mitogen-activated protein kinase and c-Fos in dendritic cells.
Dillon S, Agrawal A, Van Dyke T, Landreth G, McCauley L, Koh A, Maliszewski C, Akira S, Pulendran B. Dillon S, et al. J Immunol. 2004 Apr 15;172(8):4733-43. doi: 10.4049/jimmunol.172.8.4733. J Immunol. 2004. PMID: 15067049 - The adaptor molecule TIRAP provides signalling specificity for Toll-like receptors.
Horng T, Barton GM, Flavell RA, Medzhitov R. Horng T, et al. Nature. 2002 Nov 21;420(6913):329-33. doi: 10.1038/nature01180. Nature. 2002. PMID: 12447442 - Regulation of dendritic cell function through Toll-like receptors.
Kaisho T, Akira S. Kaisho T, et al. Curr Mol Med. 2003 Jun;3(4):373-85. doi: 10.2174/1566524033479726. Curr Mol Med. 2003. PMID: 12776992 Review. - Regulation of dendritic cell function through toll-like receptors.
Kaisho T, Akira S. Kaisho T, et al. Curr Mol Med. 2003 Dec;3(8):759-71. doi: 10.2174/1566524033479366. Curr Mol Med. 2003. PMID: 14682496 Review.
Cited by
- Hyaluronan Receptors as Mediators and Modulators of the Tumor Microenvironment.
Carvalho AM, Reis RL, Pashkuleva I. Carvalho AM, et al. Adv Healthc Mater. 2023 Feb;12(5):e2202118. doi: 10.1002/adhm.202202118. Epub 2022 Nov 28. Adv Healthc Mater. 2023. PMID: 36373221 Free PMC article. Review. - Toll-like receptor 4 activation in cancer progression and therapy.
Oblak A, Jerala R. Oblak A, et al. Clin Dev Immunol. 2011;2011:609579. doi: 10.1155/2011/609579. Epub 2011 Nov 3. Clin Dev Immunol. 2011. PMID: 22110526 Free PMC article. Review. - The Endothelial Glycocalyx as a Target of Ischemia and Reperfusion Injury in Kidney Transplantation-Where Have We Gone So Far?
Duni A, Liakopoulos V, Koutlas V, Pappas C, Mitsis M, Dounousi E. Duni A, et al. Int J Mol Sci. 2021 Feb 22;22(4):2157. doi: 10.3390/ijms22042157. Int J Mol Sci. 2021. PMID: 33671524 Free PMC article. Review. - Hyaluronan is a natural and effective immunological adjuvant for protein-based vaccines.
Dalla Pietà A, Carpanese D, Grigoletto A, Tosi A, Dalla Santa S, Pedersen GK, Christensen D, Meléndez-Alafort L, Barbieri V, De Benedictis P, Pasut G, Montagner IM, Rosato A. Dalla Pietà A, et al. Cell Mol Immunol. 2021 May;18(5):1197-1210. doi: 10.1038/s41423-021-00667-y. Epub 2021 Mar 24. Cell Mol Immunol. 2021. PMID: 33762685 Free PMC article. - Differences in local versus systemic TNFalpha production in COPD: inhibitory effect of hyaluronan on LPS induced blood cell TNFalpha release.
Dentener MA, Louis R, Cloots RH, Henket M, Wouters EF. Dentener MA, et al. Thorax. 2006 Jun;61(6):478-84. doi: 10.1136/thx.2005.053330. Epub 2006 Mar 3. Thorax. 2006. PMID: 16517575 Free PMC article.
References
- Agren, U.M., R.H. Tammi, and M.I. Tammi. 1997. Reactive oxygen species contribute to epidermal hyaluronan catabolism in human skin organ culture. Free Radic. Biol. Med. 23:996–1001. - PubMed
- Weigel, P.H., G.M. Fuller, and R.D. LeBoeuf. 1986. A model for the role of hyaluronic acid and fibrin in the early events during the inflammatory response and wound healing. J. Theor. Biol. 119:219–234. - PubMed
- Laurent, T.C., and J.R. Fraser. 1992. Hyaluronan. FASEB J. 6:2397–2404. - PubMed
- Termeer, C., J. Hennies, U. Voith, T. Ahrens, J.M. Weiss, P. Prehm, and J.C. Simon. 2000. Oligosaccharides of Hyaluronan are potent activators of dendritic cells. J. Immunol. 165:1863–1870. - PubMed
Publication types
MeSH terms
Substances
LinkOut - more resources
Full Text Sources
Other Literature Sources


