A genomewide scan identifies two novel loci involved in specific language impairment - PubMed (original) (raw)
A genomewide scan identifies two novel loci involved in specific language impairment
SLI Consortium. Am J Hum Genet. 2002 Feb.
Abstract
Approximately 4% of English-speaking children are affected by specific language impairment (SLI), a disorder in the development of language skills despite adequate opportunity and normal intelligence. Several studies have indicated the importance of genetic factors in SLI; a positive family history confers an increased risk of development, and concordance in monozygotic twins consistently exceeds that in dizygotic twins. However, like many behavioral traits, SLI is assumed to be genetically complex, with several loci contributing to the overall risk. We have compiled 98 families drawn from epidemiological and clinical populations, all with probands whose standard language scores fall > or =1.5 SD below the mean for their age. Systematic genomewide quantitative-trait-locus analysis of three language-related measures (i.e., the Clinical Evaluation of Language Fundamentals-Revised [CELF-R] receptive and expressive scales and the nonword repetition [NWR] test) yielded two regions, one on chromosome 16 and one on 19, that both had maximum LOD scores of 3.55. Simulations suggest that, of these two multipoint results, the NWR linkage to chromosome 16q is the most significant, with empirical P values reaching 10(-5), under both Haseman-Elston (HE) analysis (LOD score 3.55; P=.00003) and variance-components (VC) analysis (LOD score 2.57; P=.00008). Single-point analyses provided further support for involvement of this locus, with three markers, under the peak of linkage, yielding LOD scores >1.9. The 19q locus was linked to the CELF-R expressive-language score and exceeds the threshold for suggestive linkage under all types of analysis performed-multipoint HE analysis (LOD score 3.55; empirical P=.00004) and VC (LOD score 2.84; empirical P=.00027) and single-point HE analysis (LOD score 2.49) and VC (LOD score 2.22). Furthermore, both the clinical and epidemiological samples showed independent evidence of linkage on both chromosome 16q and chromosome 19q, indicating that these may represent universally important loci in SLI and, thus, general risk factors for language impairment.
Figures
Figure 1
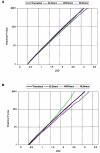
LOD-score–significance distributions for each measure used in the genome screen. The thicker black lines show the theoretical probability for any given LOD score, under the appropriate analyses; the colored lines show the phenotype-specific empirical probabilities for any given LOD score. Because of sample-specific deviations from assumptions critical to different analyses (see the “Subjects and Methods” section), empirical P values may differ from theoretical P values. Comparisons between empirical and theoretical probability distributions thus allow the quantification of these deviations for each phenotype. A, Relationship between HE LOD scores and pointwise significance of linkage in the total genome-screen sample. Simulations demonstrate that the unweighted HE approach does not lead to increased type I errors in our data set (i.e., the empirical distributions coincide with the theoretical distribution). B, Relationship between VC LOD scores and pointwise significance of linkage in the total genome-screen sample. Under VC analysis, ELStrans and RLStrans behave as predicted by theory, whereas the theoretical P values for NWRtrans are overly conservative.
Figure 2
Genomewide plot of HE linkage to three language-related measures under multipoint HE analysis. Abbreviations for language measures are as in the Subjects and Methods section. The _X_-axis shows cumulative distance (in Haldane cM); chromosome numbers are displayed along the top of the graph. Genomewide information content was calculated by MAPMAKER/SIBS. The average information content across the genome is 71%. Note the magnitude of the linkages to chromosomes 16 and 19, in relation to the general background of the genome. VC analysis of the genome fully supported the HE results. All VC LOD scores >1.0 are reported in table 5.
Figure 3
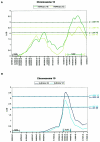
Suggestive linkage to chromosomes 16 and 19. The _X_-axis shows positions of the markers typed; a 10-cM (Haldane) bar is given for reference. A, Linkage to chromosome 16, under both the HE method and the VC method, for NWRtrans. For ELStrans and RLStrans, the LOD scores remained <0.42 and <0.27, respectively, for the entire chromosome (data not shown). A 1-LOD interval is shown for both the HE peak and the VC peak, by the dark-green and light-green bars, respectively. Light-green lines show the LOD-score thresholds for empirical P values of .001 and .0001 for NWRtrans under VC analysis; dark-green lines show the same LOD-score thresholds under HE analysis. B, Linkage to chromosome 19, under both the HE method and the VC method, for ELStrans. For RLStrans and the NWRtrans, the highest LOD scores were 0.33 and 0.20, respectively, for the entire chromosome (data not shown). A 1-LOD interval is shown for both the HE peak and the VC peak, by the dark-blue and light-blue bars, respectively. Light-blue lines show the LOD-score thresholds for empirical P values of .001 and .0001 for ELStrans under VC analysis; dark-blue lines show the same LOD-score thresholds under HE analysis.
Figure 4
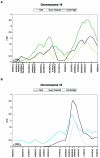
Linkage to chromosomes 16 and 19, based on the Guy's Hospital sample and the Cambridge sample. The format of the graph is as in figure 3. A, Linkage to chromosome 16, in the combined genome-screen sample, the Guy’s Hospital sample, and the Cambridge sample, for NWRtrans. Traces are shown for HE analysis only. B, Linkage to chromosome 19, in the total genome-screen sample, the Guy’s Hospital sample, and the Cambridge sample, for ELStrans. Linkage is independently demonstrated both in the Guy’s Hospital sample and in the Cambridge sample. Traces are shown for HE analysis only.
Similar articles
- Highly significant linkage to the SLI1 locus in an expanded sample of individuals affected by specific language impairment.
SLI Consortium (SLIC). SLI Consortium (SLIC). Am J Hum Genet. 2004 Jun;74(6):1225-38. doi: 10.1086/421529. Epub 2004 May 3. Am J Hum Genet. 2004. PMID: 15133743 Free PMC article. - Genetic and phenotypic effects of phonological short-term memory and grammatical morphology in specific language impairment.
Falcaro M, Pickles A, Newbury DF, Addis L, Banfield E, Fisher SE, Monaco AP, Simkin Z, Conti-Ramsden G; SLI Consortium. Falcaro M, et al. Genes Brain Behav. 2008 Jun;7(4):393-402. doi: 10.1111/j.1601-183X.2007.00364.x. Epub 2007 Nov 12. Genes Brain Behav. 2008. PMID: 18005161 - A major susceptibility locus for specific language impairment is located on 13q21.
Bartlett CW, Flax JF, Logue MW, Vieland VJ, Bassett AS, Tallal P, Brzustowicz LM. Bartlett CW, et al. Am J Hum Genet. 2002 Jul;71(1):45-55. doi: 10.1086/341095. Epub 2002 Jun 4. Am J Hum Genet. 2002. PMID: 12048648 Free PMC article. - Genetic influences on language impairment and phonological short-term memory.
Newbury DF, Bishop DV, Monaco AP. Newbury DF, et al. Trends Cogn Sci. 2005 Nov;9(11):528-34. doi: 10.1016/j.tics.2005.09.002. Epub 2005 Sep 26. Trends Cogn Sci. 2005. PMID: 16188486 Review. - Defining the genetic architecture of human developmental language impairment.
Li N, Bartlett CW. Li N, et al. Life Sci. 2012 Apr 9;90(13-14):469-75. doi: 10.1016/j.lfs.2012.01.016. Epub 2012 Feb 17. Life Sci. 2012. PMID: 22365959 Free PMC article. Review.
Cited by
- Identification of FOXP1 deletions in three unrelated patients with mental retardation and significant speech and language deficits.
Horn D, Kapeller J, Rivera-Brugués N, Moog U, Lorenz-Depiereux B, Eck S, Hempel M, Wagenstaller J, Gawthrope A, Monaco AP, Bonin M, Riess O, Wohlleber E, Illig T, Bezzina CR, Franke A, Spranger S, Villavicencio-Lorini P, Seifert W, Rosenfeld J, Klopocki E, Rappold GA, Strom TM. Horn D, et al. Hum Mutat. 2010 Nov;31(11):E1851-60. doi: 10.1002/humu.21362. Hum Mutat. 2010. PMID: 20848658 Free PMC article. - Pleiotropic effects of a chromosome 3 locus on speech-sound disorder and reading.
Stein CM, Schick JH, Gerry Taylor H, Shriberg LD, Millard C, Kundtz-Kluge A, Russo K, Minich N, Hansen A, Freebairn LA, Elston RC, Lewis BA, Iyengar SK. Stein CM, et al. Am J Hum Genet. 2004 Feb;74(2):283-97. doi: 10.1086/381562. Epub 2004 Jan 20. Am J Hum Genet. 2004. PMID: 14740317 Free PMC article. - A nonword repetition task for speakers with misarticulations: the Syllable Repetition Task (SRT).
Shriberg LD, Lohmeier HL, Campbell TF, Dollaghan CA, Green JR, Moore CA. Shriberg LD, et al. J Speech Lang Hear Res. 2009 Oct;52(5):1189-212. doi: 10.1044/1092-4388(2009/08-0047). Epub 2009 Jul 27. J Speech Lang Hear Res. 2009. PMID: 19635944 Free PMC article. - Quantitative genome-wide association analyses of receptive language in the Danish High Risk and Resilience Study.
Nudel R, Christiani CAJ, Ohland J, Uddin MJ, Hemager N, Ellersgaard D, Spang KS, Burton BK, Greve AN, Gantriis DL, Bybjerg-Grauholm J, Jepsen JRM, Thorup AAE, Mors O, Werge T, Nordentoft M. Nudel R, et al. BMC Neurosci. 2020 Jul 7;21(1):30. doi: 10.1186/s12868-020-00581-5. BMC Neurosci. 2020. PMID: 32635940 Free PMC article. - Common Genetic Variants in FOXP2 Are Not Associated with Individual Differences in Language Development.
Mueller KL, Murray JC, Michaelson JJ, Christiansen MH, Reilly S, Tomblin JB. Mueller KL, et al. PLoS One. 2016 Apr 11;11(4):e0152576. doi: 10.1371/journal.pone.0152576. eCollection 2016. PLoS One. 2016. PMID: 27064276 Free PMC article.
References
Electronic-Database Information
- Center for Statistical Genetics, University of Michigan, http://www.sph.umich.edu/statgen/software (for SIBMED)
- CHLC Genetics Maps, http://lpg.nci.nih.gov/html-chlc/ChlcMaps.html
- Division of Statistical Genetics, Department of Human Genetics, University of Pittsburgh, http://watson.hgen.pitt.edu/mega2.html (for Mega2 version 2.2)
- Généthon, http://www.genethon.fr/
- Online Mendelian Inheritance in Man (OMIM), http://www.ncbi.nlm.nih.gov/Omim (for AUTS1 [MIM 209850], FOXP2 [MIM 606354], and SPCH1 [MIM 602081])
References
- Baddeley A, Gathercole S, Papagno C (1998) The phonological loop as a language learning device. Psychol Rev 1:158–173 - PubMed
- Baddeley A, Wilson BA (1993) A developmental deficit in short-term phonological memory: implications for language and reading. Memory 1:65–78 - PubMed
- Beitchman JH, Brownlie EB, Inglis A, Wild J, Mathews R, Schachter D, Kroll R, Martin S, Ferguson B, Lancee W (1994) Seven-year follow-up of speech/language-impaired and control children: speech/language stability and outcome. J Am Acad Child Adolesc Psychiatry 33:1322–1330 - PubMed
- Bishop DVM, Adams C (1990) A prospective study of the relationship between specific language impairment, phonological disorders and reading retardation. J Child Psychol Psychiatry 31:1027–1050 - PubMed
Publication types
MeSH terms
LinkOut - more resources
Full Text Sources
Other Literature Sources
Molecular Biology Databases


