Assessment of the relationship between signal intensities and transcript concentration for Affymetrix GeneChip arrays - PubMed (original) (raw)
Assessment of the relationship between signal intensities and transcript concentration for Affymetrix GeneChip arrays
Eugene Chudin et al. Genome Biol. 2002.
Abstract
Background: Affymetrix microarrays have become increasingly popular in gene-expression studies; however, limitations of the technology have not been well established for commercially available arrays. The hybridization signal has been shown to be proportional to actual transcript concentration for specialized arrays containing hundreds of distinct probe pairs per gene. Additionally, the technology has been described as capable of distinguishing concentration levels within a factor of 2, and of detecting transcript frequencies as low as 1 in 2,000,000. Using commercially available arrays, we assessed these representations directly through a series of 'spike-in' hybridizations involving four prokaryotic transcripts in the absence and presence of fixed eukaryotic background. The contribution of probe-target interactions to the mismatch signal was quantified under various analyte concentrations.
Results: A linear relationship between transcript abundance and signal was consistently observed between 1 pM and 10 pM transcripts. The signal ceased to be linear above the 10 pM level and commenced saturating around the 100 pM level. The 0.1 pM transcripts were virtually undetectable in the presence of eukaryotic background. Our measurements show that preponderance of the signal for mismatch probes derives from interactions with the target transcripts.
Conclusions: Landmark studies outlining an observed linear relationship between signal and transcript concentration were carried out under highly specialized conditions and may not extend to commercially available arrays under routine operating conditions. Additionally, alternative metrics that are not based on the difference in the signal of members of a probe pair may further improve the quantitative utility of the Affymetrix GeneChip array.
Figures
Figure 1
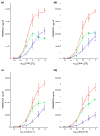
PM, MM, and ADI signals without cRNA backgroun d. PM, red; MM, blue; ADI, green. (a) PheX_3; (b) ThrX_5; (c) DapX_M; (d) LysX_5.
Figure 2
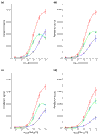
PM, MM, and ADI signals with cRNA background. PM, red; MM, blue; ADI, green. (a) PheX_3; (b) ThrX_5; (c) DapX_M; (d) LysX_5.
Figure 3
Sigmoidal fits to ADIs for PheX_3. Upper curve was obtained without cRNA background.
Figure 4
Correlation between hybridization results obtained for the same RNA sample. (a) Log space plot; (b) linear space plot. Uniform 'factor of 2' region (see text) in the log space plot does not have an intuitive physical counterpart in linear space. It underestimates variability at the low end of ADIs.
Similar articles
- Expression profiling using affymetrix genechip probe arrays.
Schinke-Braun M, Couget JA. Schinke-Braun M, et al. Methods Mol Biol. 2007;366:13-40. doi: 10.1007/978-1-59745-030-0_2. Methods Mol Biol. 2007. PMID: 17568117 - Experimental comparison and evaluation of the Affymetrix exon and U133Plus2 GeneChip arrays.
Abdueva D, Wing MR, Schaub B, Triche TJ. Abdueva D, et al. PLoS One. 2007 Sep 19;2(9):e913. doi: 10.1371/journal.pone.0000913. PLoS One. 2007. PMID: 17878948 Free PMC article. - A simple optimization can improve the performance of single feature polymorphism detection by Affymetrix expression arrays.
Horiuchi Y, Harushima Y, Fujisawa H, Mochizuki T, Kawakita M, Sakaguchi T, Kurata N. Horiuchi Y, et al. BMC Genomics. 2010 May 20;11:315. doi: 10.1186/1471-2164-11-315. BMC Genomics. 2010. PMID: 20482895 Free PMC article. - Base pair interactions and hybridization isotherms of matched and mismatched oligonucleotide probes on microarrays.
Binder H, Preibisch S, Kirsten T. Binder H, et al. Langmuir. 2005 Sep 27;21(20):9287-302. doi: 10.1021/la051231s. Langmuir. 2005. PMID: 16171364 - Characterization of mismatch and high-signal intensity probes associated with Affymetrix genechips.
Wang Y, Miao ZH, Pommier Y, Kawasaki ES, Player A. Wang Y, et al. Bioinformatics. 2007 Aug 15;23(16):2088-95. doi: 10.1093/bioinformatics/btm306. Epub 2007 Jun 6. Bioinformatics. 2007. PMID: 17553856
Cited by
- Intensity-based analysis of two-colour microarrays enables efficient and flexible hybridization designs.
't Hoen PA, Turk R, Boer JM, Sterrenburg E, de Menezes RX, van Ommen GJ, den Dunnen JT. 't Hoen PA, et al. Nucleic Acids Res. 2004 Feb 24;32(4):e41. doi: 10.1093/nar/gnh038. Nucleic Acids Res. 2004. PMID: 14982960 Free PMC article. - Functional genomics of innate host defense molecules in normal human monocytes in response to Aspergillus fumigatus.
Cortez KJ, Lyman CA, Kottilil S, Kim HS, Roilides E, Yang J, Fullmer B, Lempicki R, Walsh TJ. Cortez KJ, et al. Infect Immun. 2006 Apr;74(4):2353-65. doi: 10.1128/IAI.74.4.2353-2365.2006. Infect Immun. 2006. PMID: 16552065 Free PMC article. - MyoMiner: explore gene co-expression in normal and pathological muscle.
Malatras A, Michalopoulos I, Duguez S, Butler-Browne G, Spuler S, Duddy WJ. Malatras A, et al. BMC Med Genomics. 2020 May 11;13(1):67. doi: 10.1186/s12920-020-0712-3. BMC Med Genomics. 2020. PMID: 32393257 Free PMC article. - Divergence between motoneurons: gene expression profiling provides a molecular characterization of functionally discrete somatic and autonomic motoneurons.
Cui D, Dougherty KJ, Machacek DW, Sawchuk M, Hochman S, Baro DJ. Cui D, et al. Physiol Genomics. 2006 Feb 14;24(3):276-89. doi: 10.1152/physiolgenomics.00109.2005. Epub 2005 Nov 29. Physiol Genomics. 2006. PMID: 16317082 Free PMC article. - Validation of a novel, fully integrated and flexible microarray benchtop facility for gene expression profiling.
Baum M, Bielau S, Rittner N, Schmid K, Eggelbusch K, Dahms M, Schlauersbach A, Tahedl H, Beier M, Güimil R, Scheffler M, Hermann C, Funk JM, Wixmerten A, Rebscher H, Hönig M, Andreae C, Büchner D, Moschel E, Glathe A, Jäger E, Thom M, Greil A, Bestvater F, Obermeier F, Burgmaier J, Thome K, Weichert S, Hein S, Binnewies T, Foitzik V, Müller M, Stähler CF, Stähler PF. Baum M, et al. Nucleic Acids Res. 2003 Dec 1;31(23):e151. doi: 10.1093/nar/gng151. Nucleic Acids Res. 2003. PMID: 14627841 Free PMC article.
References
- Forman JE, Walton ID, Stern D, Rava RP, Trulson MO. Thermodynamics of duplex formation and mismatch discrimination on photolithographically synthesized oligonucleotide arrays. ACS Symp Ser. 1998;682:206–228.
- Lockhart DJ, Dong H, Byrne MC, Follettie MT, Gallo MV, Chee MS, Mittmann M, Wang C, Kobayashi M, Horton H, Brown EL. Expression monitoring by hybridization to high-density oligonucleotide arrays. Nat Biotechnol. 1996;14:1675–1680. - PubMed
- Wodicka L, Dong H, Mittmann M, Ho MH, Lockhart DJ. Genome-wide expression monitoring in Saccharomyces cerevisiae. Nat Biotechnol. 1997;15:1359–1367. - PubMed
- Lipshutz RJ, Fodor SPA, Gingeras TR, Lockhart DJ. High density synthetic oligonucleotide arrays. Nat Genet. 1999;21:20–24. - PubMed
MeSH terms
Substances
LinkOut - more resources
Full Text Sources
Other Literature Sources


