Two molecularly distinct G(2)/M checkpoints are induced by ionizing irradiation - PubMed (original) (raw)
Two molecularly distinct G(2)/M checkpoints are induced by ionizing irradiation
Bo Xu et al. Mol Cell Biol. 2002 Feb.
Abstract
Cell cycle checkpoints are among the multiple mechanisms that eukaryotic cells possess to maintain genomic integrity and minimize tumorigenesis. Ionizing irradiation (IR) induces measurable arrests in the G(1), S, and G(2) phases of the mammalian cell cycle, and the ATM (ataxia telangiectasia mutated) protein plays a role in initiating checkpoint pathways in all three of these cell cycle phases. However, cells lacking ATM function exhibit both a defective G(2) checkpoint and a prolonged G(2) arrest after IR, suggesting the existence of different types of G(2) arrest. Two molecularly distinct G(2)/M checkpoints were identified, and the critical importance of the choice of G(2)/M checkpoint assay was demonstrated. The first of these G(2)/M checkpoints occurs early after IR, is very transient, is ATM dependent and dose independent (between 1 and 10 Gy), and represents the failure of cells which had been in G(2) at the time of irradiation to progress into mitosis. Cell cycle assays that can distinguish mitotic cells from G(2) cells must be used to assess this arrest. In contrast, G(2)/M accumulation, typically assessed by propidium iodide staining, begins to be measurable only several hours after IR, is ATM independent, is dose dependent, and represents the accumulation of cells that had been in earlier phases of the cell cycle at the time of exposure to radiation. G(2)/M accumulation after IR is not affected by the early G(2)/M checkpoint and is enhanced in cells lacking the IR-induced S-phase checkpoint, such as those lacking Nbs1 or Brca1 function, because of a prolonged G(2) arrest of cells that had been in S phase at the time of irradiation. Finally, neither the S-phase checkpoint nor the G(2) checkpoints appear to affect survival following irradiation. Thus, two different G(2) arrest mechanisms are present in mammalian cells, and the type of cell cycle checkpoint assay to be used in experimental investigation must be thoughtfully selected.
Figures
FIG. 1.
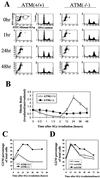
Early G2/M checkpoint and late G2 accumulation. (A) Flow-cytometric profiles of cell cycle distribution before (0 h) and at the indicated time points after IR. Staining for DNA content (PI; y axis) and for histone H3 phosphorylation (FITC; x axis) is shown in the first and the third columns. M, mitotic cell population. DNA content (PI) is shown in the second and the fourth columns. (B) Ratio (irradiated/unirradiated) of mitotic cells (staining positive for phosphorylated histone H3) as a function of time after IR in HeLa [ATM(+/+)] and GM9607 [ATM(−/−)] cells. Error bars represent the variation around the averages of at least triplicate samples. (C) Percentage of total cells in G2/M by PI staining as a function of time after 6 Gy of IR in HeLa [ATM(+/+)] and GM9607 [ATM(−/−)] cells. (D) Percentage of total cells in G2/M (PI staining) as a function of time after 6 Gy of IR in HeLa cells transfected with vector alone (vector), wild-type ATM (wtATM), or kinase-dead ATM (kdATM). All G2/M percentages are representative of at least three experiments.
FIG. 2.
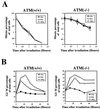
Dose dependency of the two distinct G2 checkpoints. (A) Percentage of total cells in mitosis (staining positive for phosphorylated histone H3) at early time points after different doses of IR in HeLa [ATM(+/+)] and GM9607 [ATM(−/−)] cells. Error bars represent the variation around the averages of at least triplicate samples. (B) Dose dependency of G2/M accumulation (PI staining) at various times after IR in HeLa [ATM(+/+)] and GM9607 [ATM(−/−)] cells. All results for are representative of at least three experiments.
FIG. 3.
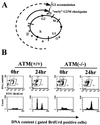
Most cells accumulating in G2/M after IR come from S phase. (A) Schematic representation of cell cycle progression after IR. Characterized checkpoints are labeled with asterisks. ①, G1 checkpoint, which is p53 dependent and occurs at restriction point; ②, ATM-dependent S-phase checkpoint, which occurs throughout S phase; ③, G2/M checkpoint, which is ATM dependent and occurs about 30 min prior to chromosome condensation. The early G2/M checkpoint measures the inhibition of cells that are in G2 at the time of IR from entering mitosis. G2/M accumulation, which is ATM independent, measures the accumulation of cells that were in S phase (or G1) at the time of irradiation. (B) HeLa [ATM(+/+)] and GM9607 [ATM(−/−)] cells were labeled with 30 μM BrdUrd for 30 min and then irradiated with 6 Gy. The top row shows flow-cytometric dot plots of BrdUrd labeling on the ordinate and DNA content on the abscissa before IR and 24 h after IR. The BrdUrd-positive cells (labeled R1) were gated and displayed as DNA content versus cell counts in the bottom row.
FIG. 4.
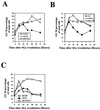
Cell lines with defective S-phase checkpoint display prolonged G2/M accumulation after IR. (A) Quantitation of G2/M accumulation at various times after IR in normal (GM0536), AT (GM1526), and NBS (NBS7078A) lymphoblastoid cell lines. (B) Quantitation of G2/M accumulation in normal (SVG), AT (GM9607), and NBS (NBS1-LBI) SV40-transformed fibroblast cell lines. (C) Quantitation of G2/M accumulation at various times after IR in tumor cell lines with normal p53 function (SY5Y), lacking p53 (H1299), and lacking full-length Brca1 (HCC1937). All results are representative of at least three different experiments.
FIG. 5.
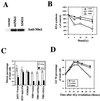
Prolonged G2 accumulation is correlated with the defective S-phase checkpoint but not the early G2/M checkpoint. NBS1-LBI cells that had been stably infected with empty vector, wild-type Nbs1, or S343A Nbs1 were used in the various checkpoint assays. (A) Expression of transduced Nbs1 proteins assessed by immunoblotting. (B) Replicative DNA synthesis assessed 30 min after various doses of IR in the NBS1-LBI cell lines. (C) Quantitation of early G2/M checkpoint data assessed by histone H3 phosphorylation in 293T cells transfected with empty vector or with kinase-dead ATM (293T+kdATM), an AT fibroblast cell line (GM5849), and the stable NBS cell lines. (D) Quantitation of percentage of total cells in G2/M as a function of time after 6 Gy of IR in the isogenic NBS cell lines. All results are representative of at least three different experiment.
FIG. 6.
Inappropriate replicative DNA synthesis after IR leads to prolonged G2/M accumulation. NBS1-LBI cells with stably introduced empty vector, wild-type Nbs1, or S343A Nbs1 were pulse-labeled with 30 μM BrdUrd 30 min before 6-Gy irradiation, and cells were harvested and analyzed at the indicated time points after IR. (A) The DNA content of cells that had taken up BrdUrd during the pulse period was examined at various times after IR. (B) Quantitation of the percentage of BrdUrd-positive NBS1-LBI cells in G2/M as a function of time after IR. All results are representative of at least three different experiments. (C) HCC1937 cells transfected with empty vector, wild-type Brca1, or S1423A Brca1 were pulse-labeled with BrdUrd, and evaluations were performed as for panel A. (D) Quantitation of BrdUrd-positive HCC1937 cells in G2/M as a function of time after IR. All results are representative of at least three different experiments.
FIG. 7.
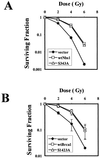
Radiation sensitivity and cell cycle checkpoint defects. (A) Expression of wild type Nbs1 (wtNbs1) or mutant Nbs1 (Serine 343 to alanine, S343A) rescues the hypersensitivity of NBS1-LBI cells in response to IR. (B) Expression of wild-type Brca1 (wtBrca1) or S1423A Brca1 rescues the radiation sensitivity of HCC1937 cells. Cells were exposed to 0 to 6 Gy of IR and incubated for 2 weeks prior to fixation, staining, and assessment of colony formation. The clonogenic survival assays were performed in triplicate. Standard errors are shown by error bars.
Similar articles
- Ataxia-telangiectasia-mutated (ATM) and NBS1-dependent phosphorylation of Chk1 on Ser-317 in response to ionizing radiation.
Gatei M, Sloper K, Sorensen C, Syljuäsen R, Falck J, Hobson K, Savage K, Lukas J, Zhou BB, Bartek J, Khanna KK. Gatei M, et al. J Biol Chem. 2003 Apr 25;278(17):14806-11. doi: 10.1074/jbc.M210862200. Epub 2003 Feb 14. J Biol Chem. 2003. PMID: 12588868 - Three independent mechanisms for arrest in G2 after ionizing radiation.
Landsverk KS, Patzke S, Rein ID, Stokke C, Lyng H, De Angelis PM, Stokke T. Landsverk KS, et al. Cell Cycle. 2011 Mar 1;10(5):819-29. doi: 10.4161/cc.10.5.14968. Epub 2011 Mar 1. Cell Cycle. 2011. PMID: 21325885 - An imperfect G2M checkpoint contributes to chromosome instability following irradiation of S and G2 phase cells.
Krempler A, Deckbar D, Jeggo PA, Löbrich M. Krempler A, et al. Cell Cycle. 2007 Jul 15;6(14):1682-6. doi: 10.4161/cc.6.14.4480. Epub 2007 May 21. Cell Cycle. 2007. PMID: 17637566 Review. - Ataxia-telangiectasia-like disorder (ATLD)-its clinical presentation and molecular basis.
Taylor AM, Groom A, Byrd PJ. Taylor AM, et al. DNA Repair (Amst). 2004 Aug-Sep;3(8-9):1219-25. doi: 10.1016/j.dnarep.2004.04.009. DNA Repair (Amst). 2004. PMID: 15279810 Review.
Cited by
- Downregulation of vimentin expression increased drug resistance in ovarian cancer cells.
Huo Y, Zheng Z, Chen Y, Wang Q, Zhang Z, Deng H. Huo Y, et al. Oncotarget. 2016 Jul 19;7(29):45876-45888. doi: 10.18632/oncotarget.9970. Oncotarget. 2016. PMID: 27322682 Free PMC article. - Mitosis-specific anchoring of gamma tubulin complexes by pericentrin controls spindle organization and mitotic entry.
Zimmerman WC, Sillibourne J, Rosa J, Doxsey SJ. Zimmerman WC, et al. Mol Biol Cell. 2004 Aug;15(8):3642-57. doi: 10.1091/mbc.e03-11-0796. Epub 2004 May 14. Mol Biol Cell. 2004. PMID: 15146056 Free PMC article. - Caffeine and human DNA metabolism: the magic and the mystery.
Kaufmann WK, Heffernan TP, Beaulieu LM, Doherty S, Frank AR, Zhou Y, Bryant MF, Zhou T, Luche DD, Nikolaishvili-Feinberg N, Simpson DA, Cordeiro-Stone M. Kaufmann WK, et al. Mutat Res. 2003 Nov 27;532(1-2):85-102. doi: 10.1016/j.mrfmmm.2003.08.012. Mutat Res. 2003. PMID: 14643431 Free PMC article. - G2 checkpoint control and G2 chromosomal radiosensitivity in cancer survivors and their families.
Cadwell KK, Curwen GB, Tawn EJ, Winther JF, Boice JD Jr. Cadwell KK, et al. Mutagenesis. 2011 Mar;26(2):291-4. doi: 10.1093/mutage/geq087. Epub 2010 Nov 2. Mutagenesis. 2011. PMID: 21044988 Free PMC article. - Role for hACF1 in the G2/M damage checkpoint.
Sánchez-Molina S, Mortusewicz O, Bieber B, Auer S, Eckey M, Leonhardt H, Friedl AA, Becker PB. Sánchez-Molina S, et al. Nucleic Acids Res. 2011 Oct;39(19):8445-56. doi: 10.1093/nar/gkr435. Epub 2011 Jul 11. Nucleic Acids Res. 2011. PMID: 21745822 Free PMC article.
References
- Ahn, J. Y., J. K. Schwarz, H. Piwnica-Worms, and C. E. Canman. 2000. Threonine 68 phosphorylation by ataxia telangiectasia mutated is required for efficient activation of Chk2 in response to ionizing radiation. Cancer Res. 60:5934-5936. - PubMed
- Banin, S., L. Moyal, S. Shieh, Y. Taya, C. W. Anderson, L. Chessa, N. I. Smorodinsky, C. Prives, Y. Reiss, Y. Shiloh, and Y. Ziv. 1998. Enhanced phosphorylation of p53 by ATM in response to DNA damage. Science 281:1674-1677. - PubMed
- Bao, S., R. S. Tibbetts, K. M. Brumbaugh, Y. Fang, D. A. Richardson, A. Ali, S. M. Chen, R. T. Abraham, and X. F. Wang. 2001. ATR/ATM-mediated phosphorylation of human Rad17 is required for genotoxic stress responses. Nature 411:969-974. - PubMed
- Beamish, H., and M. F. Lavin. 1994. Radiosensitivity in ataxia-telangiectasia: anomalies in radiation-induced cell cycle delay. Int. J. Radiat. Biol. 65:175-184. - PubMed
- Beamish, H., R. Williams, P. Chen, and M. F. Lavin. 1996. Defect in multiple cell cycle checkpoints in ataxia-telangiectasia postirradiation. J. Biol. Chem. 271:20486-20493. - PubMed
Publication types
MeSH terms
Substances
LinkOut - more resources
Full Text Sources
Other Literature Sources
Medical
Research Materials
Miscellaneous
