Fas receptor signaling inhibits glycogen synthase kinase 3 beta and induces cardiac hypertrophy following pressure overload - PubMed (original) (raw)
Fas receptor signaling inhibits glycogen synthase kinase 3 beta and induces cardiac hypertrophy following pressure overload
Cornel Badorff et al. J Clin Invest. 2002 Feb.
Abstract
Congestive heart failure is a leading cause of mortality in developed countries. Myocardial hypertrophy resulting from hypertension often precedes heart failure. Understanding the signaling underlying cardiac hypertrophy and failure is of major interest. Here, we identified Fas receptor activation, a classical death signal causing apoptosis via activation of the caspase cascade in many cell types, as a novel pathway mediating cardiomyocyte hypertrophy in vitro and in vivo. Fas activation by Fas ligand induced a hypertrophic response in cultured cardiomyocytes, which was dependent on the inactivation of glycogen synthase kinase 3 beta (GSK3 beta) by phosphorylation. In vivo, lpr (lymphoproliferative disease) mice lacking a functional Fas receptor demonstrated rapid-onset left ventricular dilatation and failure, absence of compensatory hypertrophy, and significantly increased mortality in response to pressure overload induction that was accompanied by a failure to inhibit GSK3 beta activity. In contrast, Fas ligand was dispensable for the development of pressure overload hypertrophy in vivo. In vitro, neonatal cardiomyocytes from lpr mice showed a completely abrogated or significantly blunted hypertrophic response after stimulation with Fas ligand or angiotensin II, respectively. These findings indicate that Fas receptor signaling inhibits GSK3 beta activity in cardiomyocytes and is required for compensation of pressure overload in vivo.
Figures
Figure 1
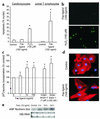
Fas ligand induces cardiomyocyte hypertrophy but not apoptosis. (a) Neonatal rat cardiomyocytes or Jurkat T lymphocytes were treated with Fas ligand or H2O2, and apoptosis was assessed by DAPI staining. Data are mean ± SEM from four independent experiments. *P < 0.05 versus control. (b) Annexin V staining of rat cardiomyocytes following treatment with Fas ligand or H2O2. (c) [3H] leucine incorporation of rat cardiomyocytes following treatment with Fas ligand, angiotensin II, or endothelin-1. Data are mean ± SEM from four independent experiments. *P < 0.05 versus control. (d) Myosin light chain 2v immunofluorescence of rat cardiomyocytes following treatment with Fas ligand. (e) Increased ANF mRNA detected by Northern blotting following treatment with Fas ligand for the times indicated. Representative images of three independent experiments are shown in c–e.
Figure 2
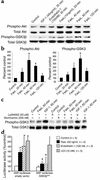
Fas ligand induces Akt and GSK3β phosphorylation in cardiomyocytes. (a) Rat cardiomyocytes were stimulated with IGF-1, endothelin-1, or Fas ligand for the times indicated. Lysates were immunoprobed for phospho-Akt or phospho-GSK3β, followed by reprobes for total Akt or total GSK3β, respectively. A representative blot from three independent experiments is shown. (b) Quantitative densitometric analyses of the phospho-Akt and phospho-GSK3β bands normalized for total Akt or GSK3. Data are mean ± SEM from three independent experiments for each data point. *P < 0.05 versus control. (c) Cardiomyocytes were pretreated with Ly294002 or wortmannin followed by stimulation with Fas ligand or IGF-1, immunoblotting with phospho-GSK3β antibody, and a reprobe for total GSK3β. (d) Cardiomyocytes were cotransfected with an ANF promoter-driven luciferase reporter together with either empty vector (left) or a nonphosphorylatable GSK3β construct (GSK3βS9A) (right) followed by stimulation with Fas ligand. Data are mean ± SEM from three to four independent experiments. *P < 0.05 for stimulation versus control; #P < 0.05 for GSK3βS9A versus empty vector. FasL, Fas ligand.
Figure 3
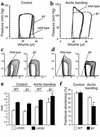
Heart failure of lpr mice in response to pressure overload. (a and b) Representative, superimposed, steady-state pressure-volume loops of a wild-type (black) or lpr mouse (gray) 2 days after sham-operation (a) or abdominal aortic banding (b). (c and d) Representative pressure-volume loops during transient reduction of cardiac preload 2 days after sham-operation (c) or abdominal aortic banding (d). (e and f) Echocardiographic measurements of surviving wild-type (WT) and lpr mice 14 days after induction of pressure overload. The mean ± SEM from six mice per group is shown. *P < 0.05 for aortic banding versus control. LVEDD, left ventricular end-diastolic diameter; LVESD, left ventricular end-systolic diameter.
Figure 4
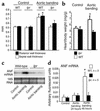
Cardiac hypertrophy in wild-type but not lpr mice after pressure overload. (a) Echocardiographic septal (white bars) and posterior wall (black bars) thicknesses of wild-type and lpr mice 14 days after induction of pressure overload. The mean ± SEM from six mice per group is shown. *P < 0.05 for aortic banding versus control. (b) Heart-to-body-weight ratios of wild-type (white bars) versus lpr mice (black bars) 14 days after induction of pressure overload. The mean ± SEM from six mice per group is shown. *P < 0.05 for aortic banding versus control. (c and d) ANF mRNA expression 2 days after induction of pressure overload in wild-type and lpr mice compared with sham-operated animals. (c) A representative ANF Northern blot (upper panel) is shown. 18S RNA (lower panel) demonstrates equal loading. (d) ANF mRNA group data derived from real-time RT-PCR of wild-type (white bars) and lpr mice (black bars) at the times indicated following abdominal aortic banding. The mean ± SEM from three mice per group is shown. *P < 0.05 for aortic banding versus control.
Figure 5
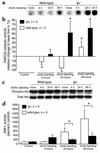
Lpr mice fail to inhibit GSK3β in response to pressure overload. (a) Representative GSK3β immunocomplex kinase assay dot blots of myocardial homogenates at the times indicated following aortic banding. (b) Group data derived from densitometric quantitation. Shown is the relative change (mean ± SEM) in GSK3β activity compared with control in wild-type (white bars) and lpr hearts (black bars); n = 3 per group. *P < 0.05 for aortic banding versus control. (c) Immunoblotting for phospho-Akt (top panel) followed by a reprobe for total Akt (bottom panel) of myocardial homogenates at the times indicated following induction of pressure overload. Shown is a representative blot from three animals in each group. (d) JNK1 activity in mouse heart homogenates following induction of pressure overload. Shown is the mean ± SEM in wild-type (white bars) and lpr hearts (black bars); n = 3 per group. *P < 0.05 for wild-type versus lpr.
Figure 6
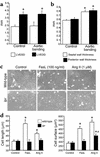
Fas ligand is dispensable for pressure overload hypertrophy in vivo, and Fas receptor mediates Fas ligand–independent signaling. (a) Echocardiographic left ventricular end-diastolic diameter (LVEDD) and end-systolic diameter (LVESD) of gld mice at base line (left, n = 4) and 14 days after induction of pressure overload (right, n = 8). The mean ± SEM is shown. *P ≤ 0.05 for aortic banding versus control. (b) Echocardiographic septal (white bars) and posterior wall (black bars) thicknesses of gld mice at base line (left, n = 4) and 14 days after induction of pressure overload (right, n = 8). The mean ± SEM is shown. *P ≤ 0.05 for aortic banding versus control. (c) Representative photomicrographs (×400) of wild-type (top) or Fas-deficient lpr (bottom) mouse neonatal cardiomyocytes unstimulated (left) or stimulated with either Fas ligand (middle) or angiotensin II (Ang II; right) at the indicated concentrations for 48 hours. A typical experiment is presented. (d) Maximal cell length (left panel) and cell surface area (right panel) of wild-type (white bars) and lpr cardiomyocytes (black bars). n = 10 randomly chosen cells per group. *P ≤ 0.01 for stimulation versus control; #P ≤ 0.01 for wild-type versus lpr.
Similar articles
- Enhanced Galphaq signaling: a common pathway mediates cardiac hypertrophy and apoptotic heart failure.
Adams JW, Sakata Y, Davis MG, Sah VP, Wang Y, Liggett SB, Chien KR, Brown JH, Dorn GW 2nd. Adams JW, et al. Proc Natl Acad Sci U S A. 1998 Aug 18;95(17):10140-5. doi: 10.1073/pnas.95.17.10140. Proc Natl Acad Sci U S A. 1998. PMID: 9707614 Free PMC article. - Role of p38 mitogen-activated protein kinase phosphorylation and Fas-Fas ligand interaction in morphine-induced macrophage apoptosis.
Singhal PC, Bhaskaran M, Patel J, Patel K, Kasinath BS, Duraisamy S, Franki N, Reddy K, Kapasi AA. Singhal PC, et al. J Immunol. 2002 Apr 15;168(8):4025-33. doi: 10.4049/jimmunol.168.8.4025. J Immunol. 2002. PMID: 11937560 - The cardiac Fas (APO-1/CD95) Receptor/Fas ligand system : relation to diastolic wall stress in volume-overload hypertrophy in vivo and activation of the transcription factor AP-1 in cardiac myocytes.
Wollert KC, Heineke J, Westermann J, Lüdde M, Fiedler B, Zierhut W, Laurent D, Bauer MK, Schulze-Osthoff K, Drexler H. Wollert KC, et al. Circulation. 2000 Mar 14;101(10):1172-8. doi: 10.1161/01.cir.101.10.1172. Circulation. 2000. PMID: 10715265 - Role of the renin-angiotensin system in cardiac hypertrophy.
Yamazaki T, Komuro I, Yazaki Y. Yamazaki T, et al. Am J Cardiol. 1999 Jun 17;83(12A):53H-57H. doi: 10.1016/s0002-9149(99)00259-3. Am J Cardiol. 1999. PMID: 10750588 Review. - The role of Fas in the progression of ischemic heart failure: prohypertrophy or proapoptosis.
Feng QZ, Zhao YS, Abdelwahid E. Feng QZ, et al. Coron Artery Dis. 2008 Nov;19(7):527-34. doi: 10.1097/MCA.0b013e3283093707. Coron Artery Dis. 2008. PMID: 18923250 Review.
Cited by
- Transcription factor Foxo3a prevents apoptosis by regulating calcium through the apoptosis repressor with caspase recruitment domain.
Lu D, Liu J, Jiao J, Long B, Li Q, Tan W, Li P. Lu D, et al. J Biol Chem. 2013 Mar 22;288(12):8491-8504. doi: 10.1074/jbc.M112.442061. Epub 2013 Feb 4. J Biol Chem. 2013. PMID: 23382383 Free PMC article. - Electrophysiologic Effects of Growth Hormone Post-Myocardial Infarction.
Stamatis KV, Kontonika M, Daskalopoulos EP, Kolettis TM. Stamatis KV, et al. Int J Mol Sci. 2020 Jan 30;21(3):918. doi: 10.3390/ijms21030918. Int J Mol Sci. 2020. PMID: 32019245 Free PMC article. Review. - Protein kinase cascades in the regulation of cardiac hypertrophy.
Dorn GW 2nd, Force T. Dorn GW 2nd, et al. J Clin Invest. 2005 Mar;115(3):527-37. doi: 10.1172/JCI24178. J Clin Invest. 2005. PMID: 15765134 Free PMC article. Review. - Doxorubicin-induced chronic dilated cardiomyopathy-the apoptosis hypothesis revisited.
Kankeu C, Clarke K, Passante E, Huber HJ. Kankeu C, et al. J Mol Med (Berl). 2017 Mar;95(3):239-248. doi: 10.1007/s00109-016-1494-0. Epub 2016 Dec 8. J Mol Med (Berl). 2017. PMID: 27933370 Review. - TNF revisited: osteoprotegerin and TNF-related molecules in heart failure.
Ueland T, Yndestad A, Dahl CP, Gullestad L, Aukrust P. Ueland T, et al. Curr Heart Fail Rep. 2012 Jun;9(2):92-100. doi: 10.1007/s11897-012-0088-6. Curr Heart Fail Rep. 2012. PMID: 22453763 Review.
References
- Hunter JJ, Chien KR. Signaling pathways for cardiac hypertrophy and failure. N Engl J Med. 1999;341:1276–1283. - PubMed
- Adams KF., Jr New epidemiologic perspectives concerning mild-to-moderate heart failure. Am J Med. 2001;110(Suppl. 7A):6S–13S. - PubMed
- Narula J, et al. Apoptosis in myocytes in end-stage heart failure. N Engl J Med. 1996;335:1182–1189. - PubMed
- MacLellan WR, Schneider MD. Death by design: programmed cell death in cardiovascular biology and disease. Circ Res. 1997;81:137–144. - PubMed
- Hirota H, et al. Loss of a gp130 cardiac muscle cell survival pathway is a critical event in the onset of heart failure during biomechanical stress. Cell. 1999;97:189–198. - PubMed
Publication types
MeSH terms
Substances
LinkOut - more resources
Full Text Sources
Other Literature Sources
Research Materials
Miscellaneous
