I(h) channels contribute to the different functional properties of identified dopaminergic subpopulations in the midbrain - PubMed (original) (raw)
I(h) channels contribute to the different functional properties of identified dopaminergic subpopulations in the midbrain
Henrike Neuhoff et al. J Neurosci. 2002.
Abstract
Dopaminergic (DA) midbrain neurons in the substantia nigra (SN) and ventral tegmental area (VTA) are involved in various brain functions such as voluntary movement and reward and are targets in disorders such as Parkinson's disease and schizophrenia. To study the functional properties of identified DA neurons in mouse midbrain slices, we combined patch-clamp recordings with either neurobiotin cell-filling and triple labeling confocal immunohistochemistry, or single-cell RT-PCR. We discriminated four DA subpopulations based on anatomical and neurochemical differences: two calbindin D28-k (CB)-expressing DA populations in the substantia nigra (SN/CB+) or ventral tegmental area (VTA/CB+), and respectively, two calbindin D28-k negative DA populations (SN/CB-, VTA/CB-). VTA/CB+ DA neurons displayed significantly faster pacemaker frequencies with smaller afterhyperpolarizations compared with other DA neurons. In contrast, all four DA populations possessed significant differences in I(h) channel densities and I(h) channel-mediated functional properties like sag amplitudes and rebound delays in the following order: SN/CB- --> VTA/CB- --> SN/CB+ --> VTA/CB+. Single-cell RT-multiplex PCR experiments demonstrated that differential calbindin but not calretinin expression is associated with differential I(h) channel densities. Only in SN/CB- DA neurons, however, I(h) channels were actively involved in pacemaker frequency control. In conclusion, diversity within the DA system is not restricted to distinct axonal projections and differences in synaptic connectivity, but also involves differences in postsynaptic conductances between neurochemically and topographically distinct DA neurons.
Figures
Fig. 1.
Electrophysiological properties and anatomical distribution of calbindin-positive and calbindin-negative dopaminergic SN neurons. A, Current-clamp recording of SN neuron with membrane voltage response to 1 sec injection of hyperpolarizing current (inset) to hyperpolarize the cell initially to −120 mV (left, top panel). Note the large sag component and the short rebound delay. During recording, the neuron was filled with 0.2% neurobiotin (filled symbols,arrows). Confocal analysis of coimmunolabeling for neurobiotin (red, right-top left panel), TH (green, right-top right panel), and CB (blue, right-bottom left panel) identified the recorded cell as a dopaminergic (TH+), calbindin-negative SN (SN/CB−) neuron (overlay, right-bottom right panel). Scale bars, 20 μm. The anatomical positions of electrophysiologically characterized and immunohistochemically identified SN/CB− neurons (n = 69; black circles) were plotted in a coronal midbrain map (left-bottom left panel) also containing other subpopulations of analyzed DA neurons (gray circles). The sag amplitudes of SN/CB− DA neurons were plotted against their corresponding rebound delays (left-bottom right panel). The mean sag amplitude and rebound delay were 37.3 ± 0.72 mV and 269.2 ± 19.41 msec, respectively (red square). _B,_Current-clamp recording of SN neuron with membrane voltage response elicited as in A (left, top panel). Note in comparison with A, the smaller sag component and prolonged rebound delay. The recorded cell was filled and processed as in A. Confocal analysis identified it as a dopaminergic (TH+) calbindin-positive SN (SN/CB+) neuron. The anatomical positions of electrophysiologically characterized and immunohistochemically identified SN/CB+ DA neurons (n = 14; black circles) were plotted in a coronal midbrain map (left-bottom left panel) also containing other subpopulations of analyzed DA neurons (gray circles). The sag amplitudes of SN/CB+ neurons were plotted against their corresponding rebound delays (left-bottom right panel). The mean sag amplitude and rebound delay were 25.3 ± 2.2 mV and 1262.4 ± 147.5 msec, respectively (Table 1).
Fig. 3.
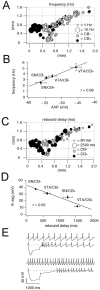
Anatomical distribution of pacemaker frequencies and rebound delays in DA neurons. A, Anatomical distribution of spontaneous pacemaker frequencies in immunohistochemically characterized and identified DA neurons (n = 125). CB+ neurons are represented by_black circles_, and CB− neurons by gray circles. Frequency is coded by symbol size (1–10 Hz). VTA/CB+ neurons display significantly higher frequencies than SN/CB− neurons (p < 0.0001) (Table 1). _B,_Linear scaling between mean spike frequencies of different DA subpopulations and respective mean amplitudes of their AHPs (r = 0.98). C, Anatomical distribution of subthreshold rebound delays in immunohistochemically characterized and identified DA neurons (n = 125). CB+ neurons are represented by black circles, and CB− neurons by gray circles. Delay is coded by symbol size (80–2500 msec). The rebound delays are significantly different between all four DA subpopulations. CB+ neurons possess longer delays compared with CB− neurons in both SN and VTA (Table 1). _D,_Linear scaling between mean rebound delays frequencies of different DA subpopulations and respective mean sag amplitudes (r = 0.95). E, Current-clamp recordings of spontaneous pacemaker activities and membrane responses to hyperpolarizing current injection of a SN/CB− neuron (top panels) in comparison with a VTA/CB+ neuron (bottom panels). SN/CB− neurons displayed slower discharge but faster rebound compared with VTA/CB+ neurons. SN/CB− neurons displayed transient postinhibitory excitation, and VTA/CB+ neurons possessed prolonged postinhibitory hypoexcitability.
Fig. 2.
Electrophysiological properties and anatomical distribution of calbindin-positive and calbindin-negative dopaminergic VTA neurons. A, Current-clamp recording of VTA neuron with membrane voltage response to 1 sec injection of hyperpolarizing current (inset) to hyperpolarize the cell initially to −120 mV (left, top panel). During recording, the neuron was filled with 0.2% neurobiotin (filled symbols, arrows). Confocal analysis of coimmunolabeling for neurobiotin (red, right-top left panel), TH (green, right-top right panel), and CB (_blue, right_-bottom left panel) identified the recorded cell as a dopaminergic (TH+), calbindin-negative VTA (VTA/CB−) neuron (overlay, right-bottom right panel). Scale bars, 20 μm. The anatomical positions of electrophysiologically characterized and immunohistochemically identified VTA/CB− neurons (n = 21; black circles) were plotted in a coronal midbrain map (left-bottom left panel) also containing other subpopulations of analyzed DA neurons (gray circles). The sag amplitudes of VTA/CB− DA neurons were plotted against their corresponding rebound delays (left-bottom right panel). The mean sag amplitude and rebound delay were 31.0 ± 1.7 mV and 632.3 ± 101.3 msec, respectively (red square). _B,_Current-clamp recording of VTA neuron with membrane voltage response elicited as in A (left, top panel). In comparison with A, note the prolonged rebound delay. The recorded cell was filled and processed as in A. Confocal analysis identified it as a dopaminergic (TH+), calbindin-positive (VTA/CB+) neuron (overlay, right-bottom right panel). The anatomical positions of electrophysiologically characterized and immunohistochemically identified VTA/CB+ DA neurons (n = 21; black circles) were plotted in a coronal midbrain map (left-bottom left panel) also containing other subpopulations of analyzed DA neurons (gray circles). The sag amplitudes of VTA/CB+ neurons were plotted against their corresponding rebound delays (left-bottom right panel). The mean sag amplitude and rebound delay were 11.9 ± 1.1 mV and 1262.4 ± 147.5 msec, respectively (Table1).
Fig. 6.
_I_h currents in identified SN DA subpopulations. A, _B,_Voltage-clamp recordings of _I_h currents elicited with 2 sec voltage-steps of increasing amplitudes from −50 to −120 mV in steps of 10 mV from a holding potential of −40 mV (top panels) in DA neurons. During recordings neurons were filled with 0.2% neurobiotin. Confocal analysis of coimmunolabeling of recorded neurons (middle panels) for neurobiotin (red, top left), TH (green, top right), and (blue, bottom left) identified the recorded cells as a dopaminergic (TH+) and determined anatomical position as well as calbindin expression (overlay, bottom right, A, SN/CB−; B, SN/CB+). Scale bars, 20 μm. Note larger _I_h currents in SN/CB− (n = 45) compared with those in SN/CB+ neurons (n = 7). Anatomical positions (black circles) were plotted in coronal midbrain maps (bottom panels) also containing other subpopulations of analyzed DA neurons (gray circles).
Fig. 4.
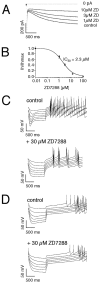
ZD7288-sensitive _I_hchannels differentially control subthreshold integration in DA subpopulations. A, Inhibition of_I_h current elicited by a voltage step to −100 mV from a holding potential of −40 mV by 1, 3, and 10 μm ZD7288. B, The mean dose–response for ZD7288 inhibition of the _I_h current in DA neurons was well described with a single Hill function with an IC50 of 2.3 μ
m
and a Hill coefficient of 1.0 (n = 6). Current-clamp recordings of membrane responses to injections of increasing hyperpolarizing currents in a SN/CB− neuron (C) in comparison with a VTA/CB+ neuron (D) under control conditions (top panel) and after complete inhibition of_I_h channels by 30 μ
m
ZD7288. Although 30 μ
m
ZD7288 completely inhibited the sag component in both SN/CB− and VTA/CB+ neurons, rebound delays and postinhibitory activity is only affected in SN/CB− neurons.
Fig. 7.
_I_h currents in identified VTA DA subpopulations. A, _B,_Voltage-clamp recordings of _I_h currents elicited with 2 sec voltage steps of increasing amplitudes from −50 to −120 mV in steps of 10 mV from a holding potential of −40 mV (top panels) in DA neurons. During recordings neurons were filled with 0.2% neurobiotin. Confocal analysis of coimmunolabeling of recorded neurons (middle panels) for neurobiotin (red, top left), TH (green, top right), and CB (blue, bottom left) identified the recorded cells as a dopaminergic (TH+) and determined anatomical position as well as calbindin expression (overlay, bottom right, A, VTA/CB−; B, VTA/CB+). Scale bars, 20 μm. Note larger _I_h currents in VTA/CB− (n = 12) compared with those in VTA/CB+ neurons (n = 12). Anatomical positions (black circles) were plotted in coronal midbrain maps (bottom panels) also containing other subpopulations of analyzed DA neurons (gray circles).
Fig. 5.
Differential single-cell calbindin mRNA expression in DA neurons is correlated with differences in_I_h current amplitudes. A,B, Single-cell phenotype–genotype correlations in DA neurons comparing _I_h currents elicited with 2 sec voltage steps of increasing amplitudes from −50 to −120 mV in steps of 10 mV from a holding potential of −40 mV (left panels) with the single-cell mRNA expression profiles of the calcium-binding proteins calretinin (CR), parvalbumin (PV), and calbindin (CB) and the neuronal marker transcripts tyrosine hydroxylase (TH) and glutamate decarboxylase (GAD 67). The products of the second, nested PCRs were run on a 2% agarose gel in parallel with a 100 bp ladder as molecular weight marker. Two representative examples of DA (TH+) neurons with either large (A) or small (B) _I_h currents and different calcium-binding protein expression profiles, CR (A) and CR+CB (B), are shown. C, D, Summaries of phenotype–genotype correlations in DA neurons. Differential single-cell calbindin mRNA expression (C) but not that of calretinin (D) was correlated with significant differences in _I_h current amplitudes in identified DA neurons (n = 49). PV was not detected in DA neurons.
Fig. 8.
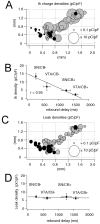
Differences in I_hcharge densities contribute to distinct rebound delays in DA subpopulations. A, Anatomical distribution of_I_h charge densities (in picocoulombs per picofarad; see Materials and Methods) in immunohistochemically characterized and identified DA neurons (n = 75). CB+ neurons are represented by black circles, and CB− neurons are represented by gray circles.I_h density is coded by symbol size (0.1–20 pC/pF) and are significantly different between all four DA subpopulations. B, Linear scaling between mean_I_h charge densities and respective mean rebound delays (r = 0.95) in DA subpopulations.C, Anatomical distribution of time-independent leak charge densities (in picocoulombs per picofarad; see Materials and Methods) in immunohistochemically characterized and identified DA neurons (n = 75). CB+ neurons are represented by_black circles, and CB− neurons are represented by_gray circles. Leak density is coded by symbol size.D, No differences in leak densities were detected in DA subpopulations and differences in rebound behavior are independent of time-independent leak charge density.
Fig. 9.
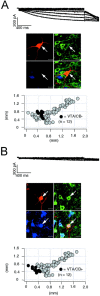
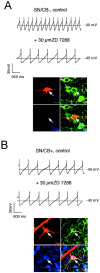
Subpopulation-selective pacemaker control by_I_h channels in SN. A,B, Current-clamp recordings in the gramicidin-perforated patch configuration at physiological temperatures in control and after application of 30 μ
m
ZD7288 (top panels) in DA neurons. At the end of the experiment, the perforated-patch was converted to the standard whole-cell configuration, and the neurons were filled with 0.2% neurobiotin. Confocal analysis of coimmunolabeling of recorded neurons (bottom panels) for neurobiotin (red, top left), TH (green, top right), and CB (blue, bottom left) identified the recorded cells as a dopaminergic (TH+) and determined calbindin expression (overlay, bottom right, A, SN/CB−;B, SN/CB+). Scale bars, 20 μm._I_h channels control pacemaker frequencies only in SN/CB− (A) but not in SN/CB+ (B).
Fig. 10.
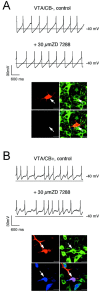
_I_h channels do not control pacemaker frequency in VTA DA neurons. A,B, Current-clamp recordings in the gramicidin-perforated patch configuration at physiological temperatures in control and after application of 30 μ
m
ZD7288 (top panels) in DA neurons. At the end of the experiment, the perforated-patch was converted to the standard whole-cell configuration, and the neurons were filled with 0.2% neurobiotin. Confocal analysis of coimmunolabeling of recorded neurons (bottom panels) for neurobiotin (red, top left), TH (green, top right), and CB (blue, bottom left) identified the recorded cells as a dopaminergic (TH+) and determined calbindin expression (_overlay, bottom right, A,_VTA/CB−; B, VTA/CB+). Scale bars, 20 μm.
Similar articles
- Differential expression of the small-conductance, calcium-activated potassium channel SK3 is critical for pacemaker control in dopaminergic midbrain neurons.
Wolfart J, Neuhoff H, Franz O, Roeper J. Wolfart J, et al. J Neurosci. 2001 May 15;21(10):3443-56. doi: 10.1523/JNEUROSCI.21-10-03443.2001. J Neurosci. 2001. PMID: 11331374 Free PMC article. - Selective coupling of T-type calcium channels to SK potassium channels prevents intrinsic bursting in dopaminergic midbrain neurons.
Wolfart J, Roeper J. Wolfart J, et al. J Neurosci. 2002 May 1;22(9):3404-13. doi: 10.1523/JNEUROSCI.22-09-03404.2002. J Neurosci. 2002. PMID: 11978817 Free PMC article. - Activity of neurochemically heterogeneous dopaminergic neurons in the substantia nigra during spontaneous and driven changes in brain state.
Brown MT, Henny P, Bolam JP, Magill PJ. Brown MT, et al. J Neurosci. 2009 Mar 4;29(9):2915-25. doi: 10.1523/JNEUROSCI.4423-08.2009. J Neurosci. 2009. PMID: 19261887 Free PMC article. - Functional diversity of ventral midbrain dopamine and GABAergic neurons.
Korotkova TM, Ponomarenko AA, Brown RE, Haas HL. Korotkova TM, et al. Mol Neurobiol. 2004 Jun;29(3):243-59. doi: 10.1385/MN:29:3:243. Mol Neurobiol. 2004. PMID: 15181237 Review. - Dissecting the diversity of midbrain dopamine neurons.
Roeper J. Roeper J. Trends Neurosci. 2013 Jun;36(6):336-42. doi: 10.1016/j.tins.2013.03.003. Epub 2013 Apr 12. Trends Neurosci. 2013. PMID: 23582338 Review.
Cited by
- The energy cost of action potential propagation in dopamine neurons: clues to susceptibility in Parkinson's disease.
Pissadaki EK, Bolam JP. Pissadaki EK, et al. Front Comput Neurosci. 2013 Mar 18;7:13. doi: 10.3389/fncom.2013.00013. eCollection 2013. Front Comput Neurosci. 2013. PMID: 23515615 Free PMC article. - Memantine block depends on agonist presentation at the NMDA receptor in substantia nigra pars compacta dopamine neurones.
Wild AR, Akyol E, Brothwell SL, Kimkool P, Skepper JN, Gibb AJ, Jones S. Wild AR, et al. Neuropharmacology. 2013 Oct;73:138-46. doi: 10.1016/j.neuropharm.2013.05.013. Epub 2013 May 28. Neuropharmacology. 2013. PMID: 23727219 Free PMC article. - Parkinson's Disease in a Dish: What Patient Specific-Reprogrammed Somatic Cells Can Tell Us about Parkinson's Disease, If Anything?
Drouin-Ouellet J, Barker RA. Drouin-Ouellet J, et al. Stem Cells Int. 2012;2012:926147. doi: 10.1155/2012/926147. Epub 2012 Dec 20. Stem Cells Int. 2012. PMID: 23316244 Free PMC article. - Mechanism of Pacemaker Activity in Zebrafish DC2/4 Dopaminergic Neurons.
Ilin VA, Bai Q, Watson AM, Volgushev M, Burton EA. Ilin VA, et al. J Neurosci. 2021 May 5;41(18):4141-4157. doi: 10.1523/JNEUROSCI.2124-20.2021. Epub 2021 Mar 17. J Neurosci. 2021. PMID: 33731451 Free PMC article. - Intact-Brain Analyses Reveal Distinct Information Carried by SNc Dopamine Subcircuits.
Lerner TN, Shilyansky C, Davidson TJ, Evans KE, Beier KT, Zalocusky KA, Crow AK, Malenka RC, Luo L, Tomer R, Deisseroth K. Lerner TN, et al. Cell. 2015 Jul 30;162(3):635-47. doi: 10.1016/j.cell.2015.07.014. Cell. 2015. PMID: 26232229 Free PMC article.
References
- Airaksinen MS, Thoenen H, Meyer M. Vulnerability of midbrain dopaminergic neurons in calbindin-D28k-deficient mice: lack of evidence for a neuroprotective role of endogenous calbindin in MPTP-treated and weaver mice. Eur J Neurosci. 1997;9:120–127. - PubMed
- Akaike N. Gramicidin perforated patch recording technique. Nippon Yakurigaku Zasshi. 1999;113:339–347. - PubMed
- Barrot M, Calza L, Pozza M, Le Moal M, Piazza PV. Differential calbindin-immunoreactivity in dopamine neurons projecting to the rat striatal complex. Eur J Neurosci. 2000;12:4578–4582. - PubMed
- Beal MF. Energetics in the pathogenesis of neurodegenerative diseases. Trends Neurosci. 2000;23:298–304. - PubMed
- Berke JD, Hyman SE. Addiction, dopamine, the molecular mechanisms of memory. Neuron. 2000;25:515–532. - PubMed
Publication types
MeSH terms
Substances
LinkOut - more resources
Full Text Sources
Other Literature Sources

