Activity deprivation reduces miniature IPSC amplitude by decreasing the number of postsynaptic GABA(A) receptors clustered at neocortical synapses - PubMed (original) (raw)
Activity deprivation reduces miniature IPSC amplitude by decreasing the number of postsynaptic GABA(A) receptors clustered at neocortical synapses
Valerie Kilman et al. J Neurosci. 2002.
Abstract
Maintaining the proper balance between excitation and inhibition is necessary to prevent cortical circuits from either falling silent or generating epileptiform activity. One mechanism through which cortical networks maintain this balance is through the activity-dependent regulation of inhibition, but whether this is achieved primarily through changes in synapse number or synaptic strength is not clear. Previously, we found that 2 d of activity deprivation increased the amplitude of miniature EPSCs (mEPSCs) onto cultured visual cortical pyramidal neurons. Here we find that this same manipulation decreases the amplitude of mIPSCs. This occurs with no change in single-channel conductance but is accompanied by a reduction in the average number of channels open during the mIPSC peak and a reduction in the intensity of staining for GABA(A) receptors (GABA(A)Rs) at postsynaptic sites. In addition, the number of synaptic sites that express detectable levels of GABA(A)Rs was decreased by approximately 50% after activity blockade, although there was no reduction in the total number of presynaptic contacts. These data suggest that activity deprivation reduces cortical inhibition by reducing both the number of GABA(A)Rs clustered at synaptic sites and the number of functional inhibitory synapses. Because excitatory and inhibitory synaptic currents are regulated in opposite directions by activity blockade, these data suggest that the balance between excitation and inhibition is dynamically regulated by ongoing activity.
Figures
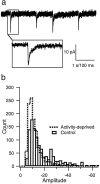
Fig. 1.
mIPSCs. a, An example of mIPSCs recorded as inward currents from a holding potential of −80 mV.Inset shows the time course of one event. Calibration: 1 sec for the top trace; 100 msec for_inset_. b, Distribution of mIPSC amplitudes recorded from neurons grown in control medium (Control; open bars) or in medium supplemented with TTX (Activity-deprived; dashed line) for 2 d before recording. Data were pooled from nine neurons in each condition (30 events per neuron).
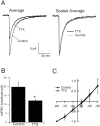
Fig. 2.
Activity blockade reduces mIPSC amplitude.A, Average, The average mIPSC from pyramidal neurons grown in control medium or medium supplemented with TTX for 2 d. Scaled Average, The average mIPSCs were scaled to the same peak value and overlaid. B, Same data set as in A; the average mIPSC amplitude for neurons grown in the two conditions. TTX is significantly different from control (p = 0.02;n = 9 neurons in each condition). C, The reversal potential for mIPSCs from neurons grown under the two conditions. Amplitudes were scaled to the values obtained at −80 mV and averaged across neurons grown under the same condition.
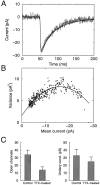
Fig. 3.
Nonstationary fluctuation analysis of mIPSCs indicates that single-channel conductance is unaffected by activity blockade. A, Representative example of the average mIPSC from a control neuron (smooth line) and an overlay of a peak-scaled individual mIPSC (noisy line), showing the fluctuations about the mean current. B, Fluctuation analysis of the neuron shown in A. Plot of variance in mIPSC current about the mean current at different times after the peak (circles). Line shows parabolic fit of the relationship. C, Estimates of the number of open channels (left) and average single-channel conductance (right) for control and TTX-treated neurons.n = 8 and 7 for control and TTX-treated neurons, respectively.
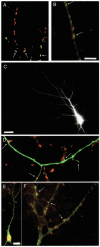
Fig. 4.
Immunocytochemical labeling of synapsin, GAD65, and GABAAR, and EGFP transfection. A, Dendrites stained against synapsin (red) and GAD65 (green), with double-labeled puncta shown in_yellow_. B, Dendrite stained against synapsin (red) and GABAARs (green), with overlap shown in_yellow_. C, Apical dendritic arbor of a pyramidal neuron transfected with EGFP. D, High-magnification image of the neuron in C, showing EGFP-labeled dendrites and immunocytochemical labeling of synapsin (in_red_). E, Pyramidal neuron double-labeled for synapsin (red) and GABAAR (green). F, Higher-magnification view of the apical dendrite shown in E. Scale bars:A, B, D, F, 5 μm; C, 25 μm; E, 15 μm.Arrows indicate colabeling of puncta (A,B, F) or synapses made onto the EGFP-filled dendrite (C).
Fig. 5.
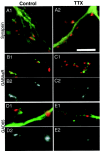
Intensity of I_mmunofluorescent labeling against synapsin, GAD65, and GABAAR in control (left) and TTX-treated (right) cultures. Minimal image processing was used for these illustrations.Black and white images were photographed with the same exposures and image-processed identically.A1, A2, The intensity of staining of synapsin puncta (red) onto EGFP-labeled dendrites (green) does not differ with TTX treatment.B1, GABAAR (green) and synapsin (red) labeling of a pyramidal apical dendrite, control condition. B2, GABAAR labeling of the dendrite in B1, shown in black and_white. C1, C2, Staining as in B1 and B2 for a pyramidal neuron from a TTX-treated culture. GABAAR labeling is less intense in TTX-treated cultures. D1, GAD65 staining (red) of EGFP-labeled apical dendrites (green), control condition; D2, GAD65 labeling of the dendrite in D1, shown in_black_ and white. E1,E2, Staining as in D1 and_D2_ for a TTX-treated culture. GAD65 staining is also less intense in TTX-treated cultures. Scale bar, 5 μm.
Fig. 6.
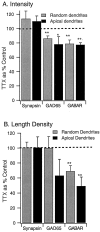
Fluorescent intensity of GABAAR labeling and the density of synaptic GABAAR puncta are reduced by activity blockade. A, Intensity of labeling of puncta for synapsin, GAD65, and GABAAR, from randomly selected dendritic regions (Random dendrites) or from pyramidal apical dendrites (Apical dendrites).B, Length density (number of immunoreactive puncta per unit length of dendrite) of puncta immunoreactive for synapsin, GAD65, or GABAAR. Data are expressed as a percentage of control;dashed line indicates control (100%). *p < 0.03; **p < 0.01.
Fig. 7.
Total apical dendritic branch length and the area of immunoreactive puncta are not affected by activity blockade.A, Average total length of the apical-like dendrite from EGFP-filled pyramidal neurons grown under control conditions (Con) or in TTX for 2 d before fixation and quantification; n = 21 and 12 for control and TTX-treated neurons, respectively. B, Average area of puncta immunolabeled for GAD65 or for synapsin (Syn), for contacts onto EGFP-filled pyramidal apical dendrites. None of the differences between conditions are statistically significant.
Fig. 8.
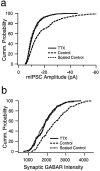
mIPSC amplitude and the fluorescent intensity of synaptic GABAAR labeling are both reduced in a multiplicative manner by activity blockade. a, Cumulative distribution of mIPSC amplitudes from nine control neurons (dashed line; 30 events per neuron) and nine neurons treated with TTX for 2 d before recording (solid line; 30 events per neuron). Scaling down the control distribution by a factor of 0.46 produced a good fit to the TTX-treated distribution. b, Cumulative distribution of the intensity measurements from synaptic GABAAR puncta from control (dashed line; 316 puncta) and neurons treated with TTX for 2 d before recording (solid line; 240 puncta). Scaling down the control distribution by a factor of 0.74 produced a good fit to the TTX-treated distribution.
Similar articles
- Diminished neuronal activity increases neuron-neuron connectivity underlying silent synapse formation and the rapid conversion of silent to functional synapses.
Nakayama K, Kiyosue K, Taguchi T. Nakayama K, et al. J Neurosci. 2005 Apr 20;25(16):4040-51. doi: 10.1523/JNEUROSCI.4115-04.2005. J Neurosci. 2005. PMID: 15843606 Free PMC article. - Estrogen regulates functional inhibition of hippocampal CA1 pyramidal cells in the adult female rat.
Rudick CN, Woolley CS. Rudick CN, et al. J Neurosci. 2001 Sep 1;21(17):6532-43. doi: 10.1523/JNEUROSCI.21-17-06532.2001. J Neurosci. 2001. PMID: 11517242 Free PMC article. - Protracted postnatal development of inhibitory synaptic transmission in rat hippocampal area CA1 neurons.
Cohen AS, Lin DD, Coulter DA. Cohen AS, et al. J Neurophysiol. 2000 Nov;84(5):2465-76. doi: 10.1152/jn.2000.84.5.2465. J Neurophysiol. 2000. PMID: 11067989 - The missing piece in the 'use it or lose it' puzzle: is inhibition regulated by activity or does it act on its own accord?
Sun QQ. Sun QQ. Rev Neurosci. 2007;18(3-4):295-310. doi: 10.1515/revneuro.2007.18.3-4.295. Rev Neurosci. 2007. PMID: 18019611 Free PMC article. Review. - The cell biology of synaptic inhibition in health and disease.
Smith KR, Kittler JT. Smith KR, et al. Curr Opin Neurobiol. 2010 Oct;20(5):550-6. doi: 10.1016/j.conb.2010.06.001. Epub 2010 Jul 23. Curr Opin Neurobiol. 2010. PMID: 20650630 Review.
Cited by
- Hibernation reduces GABA signaling in the brainstem to enhance motor activity of breathing at cool temperatures.
Saunders SE, Santin JM. Saunders SE, et al. BMC Biol. 2024 Nov 4;22(1):251. doi: 10.1186/s12915-024-02050-5. BMC Biol. 2024. PMID: 39497096 Free PMC article. - GABAergic synaptic scaling is triggered by changes in spiking activity rather than AMPA receptor activation.
Gonzalez-Islas C, Sabra Z, Fong MF, Yilmam P, Au Yong N, Engisch K, Wenner P. Gonzalez-Islas C, et al. Elife. 2024 Jun 28;12:RP87753. doi: 10.7554/eLife.87753. Elife. 2024. PMID: 38941139 Free PMC article. - Enhanced Synaptic Inhibition in the Dorsolateral Geniculate Nucleus in a Mouse Model of Glaucoma.
Van Hook MJ, McCool S. Van Hook MJ, et al. eNeuro. 2024 Jul 11;11(7):ENEURO.0263-24.2024. doi: 10.1523/ENEURO.0263-24.2024. Print 2024 Jul. eNeuro. 2024. PMID: 38937109 Free PMC article. - Gephyrin promotes autonomous assembly and synaptic localization of GABAergic postsynaptic components without presynaptic GABA release.
Carricaburu E, Benner O, Burlingham SR, Dos Santos Passos C, Hobaugh N, Karr CH, Chanda S. Carricaburu E, et al. Proc Natl Acad Sci U S A. 2024 Jun 25;121(26):e2315100121. doi: 10.1073/pnas.2315100121. Epub 2024 Jun 18. Proc Natl Acad Sci U S A. 2024. PMID: 38889143 - Developmental hearing loss-induced perceptual deficits are rescued by genetic restoration of cortical inhibition.
Masri S, Mowery TM, Fair R, Sanes DH. Masri S, et al. Proc Natl Acad Sci U S A. 2024 Jun 11;121(24):e2311570121. doi: 10.1073/pnas.2311570121. Epub 2024 Jun 3. Proc Natl Acad Sci U S A. 2024. PMID: 38830095
References
- Auger C, Marty A. Heterogeneity of functional synaptic parameters among single release sites. Neuron. 1997;19:139–150. - PubMed
- Benevento LA, Bakkum BW, Cohen RS. Gamma-aminobutyric acid and somatostatin immunoreactivity in the visual cortex of normal and dark-reared rats. Brain Res. 1995;689:172–182. - PubMed
- Brünig I, Penschuck S, Berninger B, Benson J, Fritschy J-M. BDNF reduces miniature inhibitory postsynaptic currents by rapid downregulation of GABAA receptor surface expression. Eur J Neurosci. 2001;13:1320–1328. - PubMed
Publication types
MeSH terms
Substances
LinkOut - more resources
Full Text Sources
Other Literature Sources
