Thymic selection generates a large T cell pool recognizing a self-peptide in humans - PubMed (original) (raw)
. 2002 Feb 18;195(4):485-94.
doi: 10.1084/jem.20011658.
Mikaël J Pittet, Pascal Batard, Nathalie Rufer, Magda de Smedt, Philippe Guillaume, Kim Ellefsen, Danila Valmori, Danielle Liénard, Jean Plum, H Robson MacDonald, Daniel E Speiser, Jean-Charles Cerottini, Pedro Romero
Affiliations
- PMID: 11854361
- PMCID: PMC2193620
- DOI: 10.1084/jem.20011658
Thymic selection generates a large T cell pool recognizing a self-peptide in humans
Alfred Zippelius et al. J Exp Med. 2002.
Abstract
The low frequency of self-peptide-specific T cells in the human preimmune repertoire has so far precluded their direct evaluation. Here, we report an unexpected high frequency of T cells specific for the self-antigen Melan-A/MART-1 in CD8 single-positive thymocytes from human histocompatibility leukocyte antigen-A2 healthy individuals, which is maintained in the peripheral blood of newborns and adults. Postthymic replicative history of Melan-A/MART-1-specific CD8 T cells was independently assessed by quantifying T cell receptor excision circles and telomere length ex vivo. We provide direct evidence that the large T cell pool specific for the self-antigen Melan-A/MART-1 is mostly generated by thymic output of a high number of precursors. This represents the only known naive self-peptide-specific T cell repertoire directly accessible in humans.
Figures
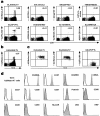
Figure 1.
High frequency of phenotypically naive circulating Melan-A–specific CD8 T Cells in HLA-A2 healthy individuals. (a) Purified CD8 T cells from individual HD 009 were stained with anti-CD3, anti-CD8 mAbs, and HLA-A2 multimers synthesized around peptides derived from self-proteins (Melan-A26–35 A27L analogue, CEA694–702, gp-100209–217 T210M analogue, tyrosinase368–376, MAGE-4130–139, MAGE-10254–262, or NY-ESO-1157–165 C165A analogue) and influenza matrix protein (Flu-MA58–66). The sequence of each peptide is shown on the top of the corresponding dot plot. Figures in upper right quadrants are the percentages of multimer+ cells in gated CD3+CD8+ cells. (b) Purified CD8 T cells from individual HD 009 were stained here with multimers synthesized around the Melan-A26–35 natural peptide. (c) Purified Melan-A–specific CD8 T cells from individual HD 009, which had been expanded in vitro were stained with an anti-CD8 mAb, and multimers synthesized around the A27L Melan-A26–35 A27L analogue (left), the Melan-A26–35 natural peptide (middle), and the irrelevant influenza matrix58–66 peptide (right). Dot plots are representative examples for six Melan-A–specific populations derived from PBMCs of adults and newborns, and from thymus. (d) Purified CD8 T cells from individual HD 009 were stained with A2/Melan-A multimers and a set of mAbs as indicated. Gated A2/Melan-A+ cells are painted in gray and negative controls are in white.
Figure 2.
CCR7+CD45RAhigh CD8 T cells contain high levels of TRECs ex vivo. (a) Purified CD8 T cells were stained with anti-CD3, anti-CD8, anti-CCR7, and anti-CD45RA mAbs. Gated CD3+CD8+ cells were sorted into four subsets on the basis of CCR7 and CD45RA expression. (b) Real time PCR quantification of TRECs was performed in whole CD8 T cells (CD8+) and in CCR7+/–CD45RAhigh/low sorted subsets obtained from four individuals (HD 008, 009, 019, and 025). Figures in the left of each bar are the percentage of the corresponding subsets within whole CD8 T cells. TREC levels in whole CD8 T cells were also calculated by adding the TREC levels obtained for each CD8 T cell subset and multiplying by their relative frequency (reconstituted CD8+).
Figure 3.
Melan-A–specific CD8 T cells in healthy individuals retain high TREC levels and long telomeres. (a) Purified CD8 T cells from HLA-A2 individuals were stained with anti-CD3 and anti-CD8 mAbs, together with PE-labeled A2/Melan-A and APC-labeled A2/Flu-MA multimers. Gated CD3+CD8+ cells were sorted into A2/Melan-A+ and A2/Flu-MA+ subsets. (b) Purified CD8 T cells were stained with anti-CD3, anti-CD8, anti-CCR7, and anti-CD45RA mAbs. Gated CD3+CD8+ cells were sorted into naive CCR7+CD45RAhigh and memory/effector non-CCR7+CD45RAhigh subsets. (c) Real time PCR quantification of TRECs was performed in whole CD8 T cells, in sorted naive and memory/effector subsets, and in sorted Melan-A and influenza-specific T cells (*, not detectable; ND, not done). Figures in the left of each bar are the percentage of the corresponding subsets in whole CD8 T cells. (d) Telomere fluorescence analysis was performed in sorted naive and memory/effector subsets, and Melan-A and influenza-specific CD8 T cells were obtained from individual HD 009. The telomere fluorescence was calculated by subtracting the mean background fluorescence from the mean fluorescence obtained with the telomere probe and is expressed in kilobase, as described in the Materials and Methods section.
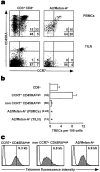
Figure 4.
Memory/effector Melan-A–specific CD8 T cells display reduced TREC levels and shortened telomeres. (a) Purified CD8 T cells were obtained from PBMCs (top) and TILNs (bottom) of melanoma patient LAU 465. In the left panels, lymphocytes were stained with anti-CD3, anti-CD8, anti-CCR7, and anti-CD45RA mAbs, and dot plots are shown for gated CD3+CD8+ cells. In the right panels, lymphocytes were stained with anti-CCR7, anti-CD45RA mAbs, and A2/Melan-A multimers, and dot plots are shown for gated A2/Melan-A+ cells. (b) Real time PCR quantification of TRECs was performed in whole CD8 T cells, in sorted naive and memory/effector CD8 T cells from PBMCs, and in sorted Melan-A–specific T cells from both PBMCs and TILNs (*, not detectable). Figures in the left of each bar are the percentage of the corresponding subsets in CD8 T cells. (c) Telomere fluorescence analysis was performed in sorted naive and memory/effector CD8 T cells from PBMCs, and Melan-A–specific CD8 T cells from TILNs. Telomere fluorescence was calculated as in Fig. 3 d, and is expressed in kilobase (see Materials and Methods).
Figure 5.
High frequency of Melan-A–specific CD8 T cells in CB and thymus. (a and b) Purified CD8 T cells from 11 CB specimens were stained with anti-CD3, anti-CD8 mAbs, and A2/Melan-A (a), or A2/Flu-MA (b) multimers. The percentage of A2/peptide multimer+ cells is given in gated CD3+CD8+ lymphocytes. (c) Purified CB CD8 T cells were stained with A2/Melan-A multimers, anti-CD3, anti-CD8, and anti-CD45RA (left) or anti-CCR7 (right) mAbs. Histograms are shown for gated CD3+CD8+A2/Melan-A+ cells and are representative examples for seven individuals. Gated A2/Melan-A+ cells are painted in gray and negative controls are in white. (d) Real time PCR quantification of TRECs was performed in whole CB CD8 T cells and in Melan-A–specific T cells (0.08% of CD8 T cells) from CB15. TREC levels in CD8 T cells are representative for four individuals. (e and f) CD4-depleted thymocytes from nine thymus specimens were stained with anti-CD3, anti-CD4, anti-CD8 mAbs, and A2/Melan-A (e) or A2/Flu-MA (f) multimers. The percentage of A2/peptide multimer+ cells is given in CD3highCD4–CD8+ thymocytes.
Figure 6.
Functional potential of Melan-A–specific CD8 SP thymocytes. (a) Purified Melan-A–specific CD8 SP thymocytes, which had been expanded in vitro, were tested in a 4-h 51Cr-release assay for their cytolytic activity against A2+ TAP-deficient T2 cells in the presence of exogenously added Melan-A26–35 (▴), Melan-A26–35 A27L analogue (▪), or irrelevant influenza matrix58–66 peptides (○). In lymphocyte to target cell ratio titrations (left), peptides were used at 1 μM. In peptide titrations (right), the lymphocyte to target cell ratio used was 10:1. Results are representative examples for six Melan-A–specific T cell populations derived from thymus and peripheral blood of newborns and adults. (b) Purified Melan-A–specific CD8 SP thymocytes, which had been expanded in vitro, were tested in a 4-h 51Cr-release assay for their cytolytic activity against Me 290 (•, A2+ / Melan-A+) and Na 8 (○, A2+ / Melan-A−) tumor cells. Results are representative examples for six Melan-A–specific T cell populations derived from thymus and peripheral blood of newborns and adults.
Similar articles
- Umbilical cord blood T cells respond against the Melan-A/MART-1 tumor antigen and exhibit reduced alloreactivity as compared with adult blood-derived T cells.
Merindol N, Grenier AJ, Caty M, Charrier E, Duval A, Duval M, Champagne MA, Soudeyns H. Merindol N, et al. J Immunol. 2010 Jul 15;185(2):856-66. doi: 10.4049/jimmunol.0902613. Epub 2010 Jun 11. J Immunol. 2010. PMID: 20543110 - Prevalent role of TCR alpha-chain in the selection of the preimmune repertoire specific for a human tumor-associated self-antigen.
Dietrich PY, Le Gal FA, Dutoit V, Pittet MJ, Trautman L, Zippelius A, Cognet I, Widmer V, Walker PR, Michielin O, Guillaume P, Connerotte T, Jotereau F, Coulie PG, Romero P, Cerottini JC, Bonneville M, Valmori D. Dietrich PY, et al. J Immunol. 2003 May 15;170(10):5103-9. doi: 10.4049/jimmunol.170.10.5103. J Immunol. 2003. PMID: 12734356 - High frequencies of naive Melan-A/MART-1-specific CD8(+) T cells in a large proportion of human histocompatibility leukocyte antigen (HLA)-A2 individuals.
Pittet MJ, Valmori D, Dunbar PR, Speiser DE, Liénard D, Lejeune F, Fleischhauer K, Cerundolo V, Cerottini JC, Romero P. Pittet MJ, et al. J Exp Med. 1999 Sep 6;190(5):705-15. doi: 10.1084/jem.190.5.705. J Exp Med. 1999. PMID: 10477554 Free PMC article. - Melan-A/MART-1-specific CD8 T cells: from thymus to tumor.
Pittet MJ, Zippelius A, Valmori D, Speiser DE, Cerottini JC, Romero P. Pittet MJ, et al. Trends Immunol. 2002 Jul;23(7):325-8. doi: 10.1016/s1471-4906(02)02244-5. Trends Immunol. 2002. PMID: 12103339 Review. No abstract available. - T cell migration during ontogeny and T cell repertoire generation.
Dunon D, Imhof BA. Dunon D, et al. Curr Top Microbiol Immunol. 1996;212:79-93. doi: 10.1007/978-3-642-80057-3_8. Curr Top Microbiol Immunol. 1996. PMID: 8934812 Review. No abstract available.
Cited by
- Analysis of the functional WT1-specific T-cell repertoire in healthy donors reveals a discrepancy between CD4(+) and CD8(+) memory formation.
Schmied S, Gostick E, Price DA, Abken H, Assenmacher M, Richter A. Schmied S, et al. Immunology. 2015 Aug;145(4):558-69. doi: 10.1111/imm.12472. Epub 2015 Jun 19. Immunology. 2015. PMID: 25882672 Free PMC article. - Mobilizing the low-avidity T cell repertoire to kill tumors.
McMahan RH, Slansky JE. McMahan RH, et al. Semin Cancer Biol. 2007 Aug;17(4):317-29. doi: 10.1016/j.semcancer.2007.06.006. Epub 2007 Jun 23. Semin Cancer Biol. 2007. PMID: 17651986 Free PMC article. Review. - 4-1BB and cytokines trigger human NK, γδ T, and CD8+ T cell proliferation and activation, but are not required for their effector functions.
Vidard L. Vidard L. Immun Inflamm Dis. 2023 Jan;11(1):e749. doi: 10.1002/iid3.749. Immun Inflamm Dis. 2023. PMID: 36705415 Free PMC article. - Primed tumor-reactive multifunctional CD62L+ human CD8+ T cells for immunotherapy.
Wölfl M, Merker K, Morbach H, Van Gool SW, Eyrich M, Greenberg PD, Schlegel PG. Wölfl M, et al. Cancer Immunol Immunother. 2011 Feb;60(2):173-86. doi: 10.1007/s00262-010-0928-8. Epub 2010 Oct 24. Cancer Immunol Immunother. 2011. PMID: 20972785 Free PMC article. - CD28neg. T lymphocytes of a melanoma patient harbor tumor immunity and a high frequency of germline-encoded and public TCRs.
Hashimoto H, Sterk M, Schilbach K. Hashimoto H, et al. Immunol Res. 2018 Feb;66(1):79-86. doi: 10.1007/s12026-017-8976-1. Immunol Res. 2018. PMID: 29138980
References
- Goldrath, A.W., and M.J. Bevan. 1999. Selecting and maintaining a diverse T-cell repertoire. Nature. 402:255–262. - PubMed
- Sandberg, J.K., L. Franksson, J. Sundback, J. Michaelsson, M. Petersson, A. Achour, R.P. Wallin, N.E. Sherman, T. Bergman, H. Jornvall, et al. 2000. T cell tolerance based on avidity thresholds rather than complete deletion allows maintenance of maximal repertoire diversity. J. Immunol. 165:25–33. - PubMed
- de Visser, K.E., T.A. Cordaro, D. Kioussis, J.B. Haanen, T.N. Schumacher, and A.M. Kruisbeek. 2000. Tracing and characterization of the low-avidity self-specific T cell repertoire. Eur. J. Immunol. 30:1458–1468. - PubMed
- Ernst, B., D.S. Lee, J.M. Chang, J. Sprent, and C.D. Surh. 1999. The peptide ligands mediating positive selection in the thymus control T cell survival and homeostatic proliferation in the periphery. Immunity. 11:173–181. - PubMed
Publication types
MeSH terms
Substances
LinkOut - more resources
Full Text Sources
Other Literature Sources
Molecular Biology Databases
Research Materials


