A basolateral sorting motif in the MICA cytoplasmic tail - PubMed (original) (raw)
A basolateral sorting motif in the MICA cytoplasmic tail
Hiroshi Suemizu et al. Proc Natl Acad Sci U S A. 2002.
Abstract
The MHC class I chain-related MICA molecule is a stress-induced, highly polymorphic, epithelia-specific, membrane-bound glycoprotein interacting with the activating NK cell receptor NKG2D and/or gut-enriched Vdelta1-bearing gammadelta T cells. We have previously reported the presence of a MICA transmembrane-encoded short-tandem repeat harboring a peculiar allele, A5.1, characterized by a frame shift mutation leading to a premature intradomain stop codon, thus denying the molecule of its 42-aa cytoplasmic tail. Given that this is the most common population-wide MICA allele found, we set out to analyze the functional consequences of cytoplasmic tail deletion. Here, we show native expression of MICA at the basolateral surface of human intestinal epithelium, the site of putative interaction with intraepithelial T and NK lymphocytes. We then demonstrate, in polarized epithelial cells, that although the full-length MICA protein is sorted to the basolateral membrane, the cytoplasmic tail-deleted construct as well as the naturally occurring A5.1 allele are aberrantly transported to the apical surface. Site-directed mutagenesis identified the cytoplasmic tail-encoded leucine-valine dihydrophobic tandem as the basolateral sorting signal. Hence, the physiological location of MICA within epithelial cells is governed by its cytoplasmic tail, implying impairment in A5.1 homozygous individuals, perhaps relevant to the immunological surveillance exerted by NK and T lymphocytes on epithelial malignancies.
Figures
Figure 1
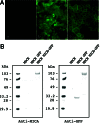
Expression of GFP-tagged MICA molecules in MDCK cells. (A) Green fluorescence signals were detected by using fluorescence microscopy in MDCK cells that were nontransfected (Left), stably transfected with the control GFP (Center), or MICA-GFP expression plasmids (Right). (B) Immunoblot analysis of GFP-tagged MICA molecules in MDCK cells: nontransfected MDCK cells (Control), MDCK cell lines stably expressing GFP (GFP), and MICA-GFP. Transferred membrane was stained with anti-MICA mouse serum (Left) or anti-GFP rabbit serum (Right). Protein size markers (kDa) are shown on the left.
Figure 2
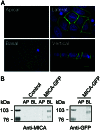
Intracellular localization of GFP-tagged MICA molecules in polarized MDCK cells. (A) MDCK cells stably expressing GFP-tagged MICA molecules. MICA-GFP fluorescence is colored by green, and nuclei are colored by blue. Fluorescence signals were analyzed by laser-scanning confocal microscopy. Confocal fluorescence micrographs (x–y plane) were acquired at the apical (Upper Left), lateral (Upper Right), and basal region (Lower Left). Confocal fluorescence micrographs (x–z plane) showing the distribution of MICA-GFP along the apical-basal axis (vertical). The scale bar is 5 μm. (B) Domain-selective cell-surface biotinylation assay of MDCK cells. Stably transfected MDCK cells expressing GFP-tagged MICA molecules were biotinylated from either the apical (AP) or basolateral (BL) domain. Biotinylated proteins were recovered by immunoprecipitation with anti-MICA mouse serum (Left) or anti-GFP rabbit serum (Right) and detected by SDS/PAGE-immunoblot analysis by using HRP-conjugated streptavidin. Control lanes on the left panel correspond to untransfected cells. Protein size markers (kDa) are shown on the left.
Figure 3
Immunofluorescence and immunoelectron micrographs of human intestinal epithelium sections stained with anti-MICA mouse serum. (A) Human intestinal epithelium was double-stained with anti-MICA mouse serum and FITC-conjugated anti-mouse Ig (green) and anti-intestinal alkaline phosphatase rabbit serum and Texas Red-conjugated anti-rabbit Ig (red). (B) Immunohistochemical detection of MICA in human intestinal epithelium by staining with anti-MICA mouse serum and HRP-conjugated anti-mouse Ig. (C) The ultrastructural localization of MICA molecules in human intestinal epithelial cells was analyzed by immunoelectron microscope employing anti-MICA mouse serum and HRP-conjugated secondary antibody. (Scale bar = 500 nm.)
Figure 4
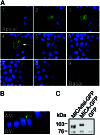
Intracellular localization of GFP-tagged MICA mutant molecules lacking the cytoplasmic domain in polarized MDCK cells. (A) MDCK cells were transiently transfected with the pEGFP-MICAdel plasmid (which lacks the 47 residues C terminus of the protein). Confocal fluorescence micrographs (x–y plane), beginning at the apical membrane (section 1, Upper Left) and ending at the basal membrane (section 9, Lower Right) were acquired in 1.0-μm increments. Arrow in optical section 4 indicates the plane of vertical section. (B) Confocal fluorescence micrograph (x–z plane) shows the distribution of GFP-tagged MICA mutant molecules lacking the cytoplasmic domain along the apical–basal axis. GFP-tagged mutant MICA-derived fluorescence is colored by green and nuclei by blue. AM, apical membrane; BM, basal membrane. The scale bar is 10 μm. (C) Immunoblot analysis of transiently expressed GFP-tagged mutant MICA molecules in MDCK cells. MDCK cells, transiently transfected with the pEGFP-MICA (MICA-GFP) or with pEGFP-MICAdel (MICAdel-GFP) plasmids, were immunoblotted with anti-MICA mouse serum. A control consisted of MDCK cells stably expressing GFP molecules alone. Sizes of marker proteins used in kDa are shown on the left.
Figure 5
Determination of the basolateral sorting motif within the MICA cytoplasmic domain by alanine substitution analysis. (A) The MICA cytoplasmic tail sequence. Boxes highlight dihydrophobic amino acids that were substituted by Ala-Ala via site-directed mutagenesis. (B) MDCK cells were transiently transfected with the alanine-substituted pEGFP-MICA plasmids. Confocal fluorescence micrographs were acquired in 1.0-μm increments. Confocal fluorescence images showing the distribution of alanine-substituted GFP-tagged MICA molecules along the apical-basal axis. GFP-tagged MICA-derived fluorescence is colored by green and nuclei by blue. AM, apical membrane; BM, basal membrane. (Scale bar = 10 μm.)
Figure 6
Intracellular localization of MICA-A5.1 molecules in polarized MDCK cells. (A) MDCK cells were transiently transfected with the pCAGGS-MICA-A5.1 plasmid. Monolayers were labeled for the apical membrane with biotin and then washed, fixed, and stained with anti-MICA mouse serum and FITC-conjugated secondary antibody. The apical cell-surface membrane was visualized by Texas Red-conjugated streptavidin. Fluorescence of MICA-A5.1 is colored by green and the apical plasma membrane by red. The fluorescence signals were analyzed by laser-scanning confocal microscopy. Confocal fluorescence micrographs (x–y plane) were acquired at the apical (Left), lateral (Center), and basal (Right) regions. (B) Confocal fluorescence micrographs (x–z plane) showing the distribution of MICA-A5.1 along the apical-basal axis. (C) MDCK cells were transiently transfected with pCAGGS-MICA and stained with anti-MICA mouse serum and FITC-conjugated secondary antibody. Nuclei stained with Hoechst 33258 are colored in blue. AM, apical membrane; BM, basal membrane. (Scale bar = 10 μm.)
Similar articles
- Identification of MICA alleles with a long Leu-repeat in the transmembrane region and no cytoplasmic tail due to a frameshift-deletion in exon 4.
Obuchi N, Takahashi M, Nouchi T, Satoh M, Arimura T, Ueda K, Akai J, Ota M, Naruse T, Inoko H, Numano F, Kimura A. Obuchi N, et al. Tissue Antigens. 2001 Jun;57(6):520-35. doi: 10.1034/j.1399-0039.2001.057006520.x. Tissue Antigens. 2001. PMID: 11556982 - Basolateral sorting of transforming growth factor-alpha precursor in polarized epithelial cells: characterization of cytoplasmic domain determinants.
Dempsey PJ, Meise KS, Coffey RJ. Dempsey PJ, et al. Exp Cell Res. 2003 May 1;285(2):159-74. doi: 10.1016/s0014-4827(03)00035-1. Exp Cell Res. 2003. PMID: 12706112 - Basolateral sorting of human poliovirus receptor alpha involves an interaction with the mu1B subunit of the clathrin adaptor complex in polarized epithelial cells.
Ohka S, Ohno H, Tohyama K, Nomoto A. Ohka S, et al. Biochem Biophys Res Commun. 2001 Oct 5;287(4):941-8. doi: 10.1006/bbrc.2001.5660. Biochem Biophys Res Commun. 2001. PMID: 11573956 - Distinct pattern of human Vdelta1 gammadelta T cells recognizing MICA.
Li J, Cui L, He W. Li J, et al. Cell Mol Immunol. 2005 Aug;2(4):253-8. Cell Mol Immunol. 2005. PMID: 16274622 Review. - Immunogenetic biomarkers in inflammatory bowel diseases: role of the IBD3 region.
Muro M, López-Hernández R, Mrowiec A. Muro M, et al. World J Gastroenterol. 2014 Nov 7;20(41):15037-48. doi: 10.3748/wjg.v20.i41.15037. World J Gastroenterol. 2014. PMID: 25386052 Free PMC article. Review.
Cited by
- Role of Polymorphisms of NKG2D Receptor and Its Ligands in Acute Myeloid Leukemia and Human Stem Cell Transplantation.
Machuldova A, Holubova M, Caputo VS, Cedikova M, Jindra P, Houdova L, Pitule P. Machuldova A, et al. Front Immunol. 2021 Mar 30;12:651751. doi: 10.3389/fimmu.2021.651751. eCollection 2021. Front Immunol. 2021. PMID: 33868289 Free PMC article. Review. - MHC class I chain-related gene A-A5.1 allele is associated with ulcerative colitis in Chinese population.
Ding Y, Xia B, Lü M, Zhang Y, Li J, Ye M, Luo H, Yu J, Zhang X, Tan J. Ding Y, et al. Clin Exp Immunol. 2005 Oct;142(1):193-8. doi: 10.1111/j.1365-2249.2005.02907.x. Clin Exp Immunol. 2005. PMID: 16178876 Free PMC article. - Role of HLA, KIR, MICA, and cytokines genes in leprosy.
Jarduli LR, Sell AM, Reis PG, Sippert EÂ, Ayo CM, Mazini PS, Alves HV, Teixeira JJ, Visentainer JE. Jarduli LR, et al. Biomed Res Int. 2013;2013:989837. doi: 10.1155/2013/989837. Epub 2013 Jul 8. Biomed Res Int. 2013. PMID: 23936864 Free PMC article. Review. - DNA sequence variation and molecular genotyping of natural killer leukocyte immunoglobulin-like receptor, LILRA3.
Norman PJ, Carey BS, Stephens HAF, Vaughan RW. Norman PJ, et al. Immunogenetics. 2003 Jun;55(3):165-171. doi: 10.1007/s00251-003-0561-1. Epub 2003 May 16. Immunogenetics. 2003. PMID: 12750859 - MICA polymorphisms and decreased expression of the MICA receptor NKG2D contribute to idiopathic pulmonary fibrosis susceptibility.
Aquino-Galvez A, Pérez-Rodríguez M, Camarena A, Falfan-Valencia R, Ruiz V, Montaño M, Barrera L, Sada-Ovalle I, Ramírez R, Granados J, Pardo A, Selman M. Aquino-Galvez A, et al. Hum Genet. 2009 Jun;125(5-6):639-48. doi: 10.1007/s00439-009-0666-1. Epub 2009 Apr 12. Hum Genet. 2009. PMID: 19363685
References
- Madden D R. Annu Rev Immunol. 1995;13:587–622. - PubMed
- Rock K L, Goldberg A L. Annu Rev Immunol. 1999;17:739–779. - PubMed
- Maenaka K, Jones E Y. Curr Opin Struct Biol. 1999;9:745–753. - PubMed
- Lanier L L. Cell. 1998;92:705–707. - PubMed
Publication types
MeSH terms
Substances
LinkOut - more resources
Full Text Sources
Other Literature Sources
Research Materials


