Specificity and robustness in transcription control networks - PubMed (original) (raw)
Specificity and robustness in transcription control networks
Anirvan M Sengupta et al. Proc Natl Acad Sci U S A. 2002.
Abstract
Recognition by transcription factors of the regulatory DNA elements upstream of genes is the fundamental step in controlling gene expression. How does the necessity to provide stability with respect to mutation constrain the organization of transcription control networks? We examine the mutation load of a transcription factor interacting with a set of n regulatory response elements as a function of the factor/DNA binding specificity and conclude on theoretical grounds that the optimal specificity decreases with n. The predicted correlation between variability of binding sites (for a given transcription factor) and their number is supported by the genomic data for Escherichia coli. The analysis of E. coli genomic data was carried out using an algorithm suggested by the biophysical model of transcription factor/DNA binding. Complete results of the search for candidate transcription factor binding sites are available at http://www.physics.rockefeller.edu/\~boris/public/search\_ecoli.
Figures
Figure 1
Schematic model of transcription control. _F_s are active transcription factor proteins, _x_s are response element subsequences upstream of the coding regions of the genes, G. Arrows indicate regulatory interactions.
Figure 2
Typical energy histogram, ρ(E), for a transcription factor interacting with a random DNA subsequences. In equilibrium, strings corresponding to energies below the chemical potential, μ (set by factor concentration), bind the factor with high probability given explicitly by + 1]−1.
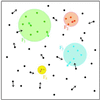
Figure 3
Response elements (dots) and factor binding subsets (disks) in sequence space. RE located within a disk binds the corresponding factor. Black dots lying outside the discs represent potential cis-regulatory sites, which must not bind transcription factors in order to avoid interference with transcription control. Arrows represent random changes in the sequence of REs (and of potential cis-regulatory sites) due to mutation.
Figure 4
The number of (candidate) response element sites, n, obtained from the E. coli genomic data versus factor binding specificity σ (circles). Note that exp(−σ) is the fraction of random sequences which bind the factor. Red line: expected number of binding sites for the random sequence background (reproducing the base frequency and nearest neighbor correlations of the noncoding segments). Green line: asymptotic fit to the predicted specificity/pleiotropy relation, Eq. 3.
Similar articles
- A biophysical approach to transcription factor binding site discovery.
Djordjevic M, Sengupta AM, Shraiman BI. Djordjevic M, et al. Genome Res. 2003 Nov;13(11):2381-90. doi: 10.1101/gr.1271603. Genome Res. 2003. PMID: 14597652 Free PMC article. - ilvIH operon expression in Escherichia coli requires Lrp binding to two distinct regions of DNA.
Jafri S, Chen S, Calvo JM. Jafri S, et al. J Bacteriol. 2002 Oct;184(19):5293-300. doi: 10.1128/JB.184.19.5293-5300.2002. J Bacteriol. 2002. PMID: 12218014 Free PMC article. - The evolution of DNA regulatory regions for proteo-gamma bacteria by interspecies comparisons.
Rajewsky N, Socci ND, Zapotocky M, Siggia ED. Rajewsky N, et al. Genome Res. 2002 Feb;12(2):298-308. doi: 10.1101/gr.207502. Genome Res. 2002. PMID: 11827949 Free PMC article. - Genome-wide similarity search for transcription factors and their binding sites in a metal-reducing prokaryote Geobacter sulfurreducens.
Yan B, Lovley DR, Krushkal J. Yan B, et al. Biosystems. 2007 Sep-Oct;90(2):421-41. doi: 10.1016/j.biosystems.2006.10.006. Epub 2006 Oct 26. Biosystems. 2007. PMID: 17184904 - The Soft Touch: Low-Affinity Transcription Factor Binding Sites in Development and Evolution.
Crocker J, Noon EP, Stern DL. Crocker J, et al. Curr Top Dev Biol. 2016;117:455-69. doi: 10.1016/bs.ctdb.2015.11.018. Epub 2016 Jan 7. Curr Top Dev Biol. 2016. PMID: 26969995 Review.
Cited by
- Genome wide identification of regulatory motifs in Bacillus subtilis.
Mwangi MM, Siggia ED. Mwangi MM, et al. BMC Bioinformatics. 2003 May 16;4:18. doi: 10.1186/1471-2105-4-18. Epub 2003 May 16. BMC Bioinformatics. 2003. PMID: 12749771 Free PMC article. - Physical constraints and functional characteristics of transcription factor-DNA interaction.
Gerland U, Moroz JD, Hwa T. Gerland U, et al. Proc Natl Acad Sci U S A. 2002 Sep 17;99(19):12015-20. doi: 10.1073/pnas.192693599. Epub 2002 Sep 6. Proc Natl Acad Sci U S A. 2002. PMID: 12218191 Free PMC article. - DNA-protein interaction studies: a historical and comparative analysis.
Ferraz RAC, Lopes ALG, da Silva JAF, Moreira DFV, Ferreira MJN, de Almeida Coimbra SV. Ferraz RAC, et al. Plant Methods. 2021 Jul 23;17(1):82. doi: 10.1186/s13007-021-00780-z. Plant Methods. 2021. PMID: 34301293 Free PMC article. Review. - Indirect and suboptimal control of gene expression is widespread in bacteria.
Price MN, Deutschbauer AM, Skerker JM, Wetmore KM, Ruths T, Mar JS, Kuehl JV, Shao W, Arkin AP. Price MN, et al. Mol Syst Biol. 2013 Apr 16;9:660. doi: 10.1038/msb.2013.16. Mol Syst Biol. 2013. PMID: 23591776 Free PMC article. - Position-specific evolution in transcription factor binding sites, and a fast likelihood calculation for the F81 model.
Selvakumar P, Siddharthan R. Selvakumar P, et al. R Soc Open Sci. 2024 Jan 24;11(1):231088. doi: 10.1098/rsos.231088. eCollection 2024 Jan. R Soc Open Sci. 2024. PMID: 38269075 Free PMC article.
References
- Gerhart J, Kirschner M. Cells, Embryos and Evolution. Oxford: Blackwell Scientific; 1997.
- Lewin B. Genes VI. Oxford: Oxford Univ. Press; 1997. p. 812.
- Ptashne M. A Genetic Switch. 2nd Ed. Oxford: Blackwell Scientific; 1992.
- Yuh CH, Bolouri H, Davidson E H. Science. 1998;279:1896–1902. - PubMed
- Neidhardt F C, editor. E. coli and Salmonella: Cellular and Molecular Biology. Washington, DC: Am. Soc. Microbiol.; 1996.
MeSH terms
Substances
LinkOut - more resources
Full Text Sources


