Extraction of functional binding sites from unique regulatory regions: the Drosophila early developmental enhancers - PubMed (original) (raw)
Comparative Study
Extraction of functional binding sites from unique regulatory regions: the Drosophila early developmental enhancers
Dmitri A Papatsenko et al. Genome Res. 2002 Mar.
Abstract
The early developmental enhancers of Drosophila melanogaster comprise one of the most sophisticated regulatory systems in higher eukaryotes. An elaborate code in their DNA sequence translates both maternal and early embryonic regulatory signals into spatial distribution of transcription factors. One of the most striking features of this code is the redundancy of binding sites for these transcription factors (BSTF). Using this redundancy, we explored the possibility of predicting functional binding sites in a single enhancer region without any prior consensus/matrix description or evolutionary sequence comparisons. We developed a conceptually simple algorithm, Scanseq, that employs an original statistical evaluation for identifying the most redundant motifs and locates the position of potential BSTF in a given regulatory region. To estimate the biological relevance of our predictions, we built thorough literature-based annotations for the best-known Drosophila developmental enhancers and we generated detailed distribution maps for the most robust binding sites. The high statistical correlation between the location of BSTF in these experiment-based maps and the location predicted in silico by Scanseq confirmed the relevance of our approach. We also discuss the definition of true binding sites and the possible biological principles that govern patterning of regulatory regions and the distribution of transcriptional signals.
Figures
Figure 1
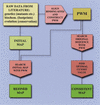
Strategies for BSTF map construction. Two strategies for constructing maps of binding sites rely on a matrix search for experimentally defined binding sites for transcription factors (BSTF). The first strategy (refined map path) is used to verify the exact location and size of the experimental sites. A second strategy (consistent map path) takes into account both the presence of the experimentally verified sites and the matrix score of found matches. The initial map is the raw footprint data from a literature source.
Figure 2
Scanseq
algorithm. Initial search is performed with words of length m with 0-k mismatches. For each word found in the sequence, the corresponding motif (word set), is refined by positional weight matrix (PWM), and is statistically evaluated through Z score. In the final stage, Z scores for motifs within a range of m and k are compared and a predicted map is generated. Note that the PWM in the
Scanseq
algorithm is not the same as in the strategy of BSTF map construction, and it does not include any a priori information about binding motifs.
Figure 3
Sensitivity of
Scanseq
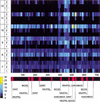
to the parameters of the initial search. Z-score profile plot (_X_-axis is the position in the sequence) is shown for the even-skipped stripe 2 enhancer using a range of length (m) and divergence (k). Each horizontal line corresponds to a combination of m (7 bp–10 bp) and k (1–3 mismatches) that are shown on the left side. Z-score values are represented by the color scale (bottom left). The bottom bar shows the distribution of binding sites for transcription factors (BSTF; consistent map) in the even-skipped stripe 2 enhancer. The best statistical correlation with the consistent map for eve stripe 2 was observed at the following parameters: {m = 7; k = 1}, {m = 8; k = 1}, and {m = 9; k = 2}.
Figure 4
(see figure on preceding page)
Scanseq
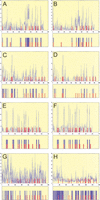
predictions. Z-score profile plots and maps of predictions are shown for even-skipped stripe 2 (panels A, B), hairy stripe 7 (panels C, D), even-skipped stripe 4+6 (panels E, F), and runt stripe 5 (panels G, H). The plots show the maximum observed Z scores (_Y_-axis) for each position in the sequence (_X_-axis) using a selected parameter range (mmin, mmax, kmax, and c). Panels A, C, E, and G (see parameters and statistics in Table 3) show the results after training on the group-of-10 enhancers. The results of individual trainings (see Table 4) are shown in panels B, D, F, and H. The predicted map is shown below each Z-score profile plot. The blue bars represent the most redundant segments (predicted by
Scanseq
); the red bars represent the established distribution for binding sites for transcription factors (BSTF): Consistent maps for even-skipped stripe 2 (Giant sites were not used in the training), hairy stripe 6, and the virtual maps for even-skipped stripe 4+6 and runt stripe 5 are shown.
Figure 5
Detailed map of predictions for even-skipped stripe 2. The comparison between the
Scanseq
predictions (in red) and the consistent map (in green) shows the efficiency of individual training (panel B) versus training on a group of 10 (panel A). In both cases, periodic sequences (ATCCC)n generated very high statistical scores.
Figure 6
Structure and conservation of tandem repeats. Periodic structures of ∼100-bp region from even-skipped stripe 2 (A, D), even-skipped stripe 4+6 (B), and fushi-tarazu proximal enhancer (C) are revealed by matrix search for Bicoid, Knirps, and Tramtrack, respectively (see also Table 5). The red arrows indicate sites that produce a positional weight matrix score in the 4–6 range (shadow sites). Evolutionary conservation in four species of Drosophila is shown for eve stripe 2 (ATCCC)n (D).
Similar articles
- Molecular dissection of cis-regulatory modules at the Drosophila bithorax complex reveals critical transcription factor signature motifs.
Starr MO, Ho MC, Gunther EJ, Tu YK, Shur AS, Goetz SE, Borok MJ, Kang V, Drewell RA. Starr MO, et al. Dev Biol. 2011 Nov 15;359(2):290-302. doi: 10.1016/j.ydbio.2011.07.028. Epub 2011 Jul 28. Dev Biol. 2011. PMID: 21821017 Free PMC article. - Evolution of developmental genes: molecular microevolution of enhancer sequences at the Ubx locus in Drosophila and its impact on developmental phenotypes.
Phinchongsakuldit J, MacArthur S, Brookfield JF. Phinchongsakuldit J, et al. Mol Biol Evol. 2004 Feb;21(2):348-63. doi: 10.1093/molbev/msh025. Epub 2003 Dec 5. Mol Biol Evol. 2004. PMID: 14660693 - Computational identification of developmental enhancers: conservation and function of transcription factor binding-site clusters in Drosophila melanogaster and Drosophila pseudoobscura.
Berman BP, Pfeiffer BD, Laverty TR, Salzberg SL, Rubin GM, Eisen MB, Celniker SE. Berman BP, et al. Genome Biol. 2004;5(9):R61. doi: 10.1186/gb-2004-5-9-r61. Epub 2004 Aug 20. Genome Biol. 2004. PMID: 15345045 Free PMC article. - Transcriptional silencing of homeotic genes in Drosophila.
Bienz M, Müller J. Bienz M, et al. Bioessays. 1995 Sep;17(9):775-84. doi: 10.1002/bies.950170907. Bioessays. 1995. PMID: 8763830 Review.
Cited by
- Computational analysis of auxin responsive elements in the Arabidopsis thaliana L. genome.
Mironova VV, Omelyanchuk NA, Wiebe DS, Levitsky VG. Mironova VV, et al. BMC Genomics. 2014;15 Suppl 12(Suppl 12):S4. doi: 10.1186/1471-2164-15-S12-S4. Epub 2014 Dec 19. BMC Genomics. 2014. PMID: 25563792 Free PMC article. - Systematic interrogation of human promoters.
Weingarten-Gabbay S, Nir R, Lubliner S, Sharon E, Kalma Y, Weinberger A, Segal E. Weingarten-Gabbay S, et al. Genome Res. 2019 Feb;29(2):171-183. doi: 10.1101/gr.236075.118. Epub 2019 Jan 8. Genome Res. 2019. PMID: 30622120 Free PMC article. - DISPARE: DIScriminative PAttern REfinement for Position Weight Matrices.
da Piedade I, Tang MH, Elemento O. da Piedade I, et al. BMC Bioinformatics. 2009 Nov 26;10:388. doi: 10.1186/1471-2105-10-388. BMC Bioinformatics. 2009. PMID: 19941641 Free PMC article. - CSMET: comparative genomic motif detection via multi-resolution phylogenetic shadowing.
Ray P, Shringarpure S, Kolar M, Xing EP. Ray P, et al. PLoS Comput Biol. 2008 Jun 6;4(6):e1000090. doi: 10.1371/journal.pcbi.1000090. PLoS Comput Biol. 2008. PMID: 18535663 Free PMC article. - A statistical thin-tail test of predicting regulatory regions in the Drosophila genome.
Shu JJ, Li Y. Shu JJ, et al. Theor Biol Med Model. 2013 Feb 14;10:11. doi: 10.1186/1742-4682-10-11. Theor Biol Med Model. 2013. PMID: 23409927 Free PMC article.
References
- Andrioli LP, Vasisht V, Wasserman KT, Oberstein A, Kaplan L, Small S. 42nd Annual Drosophila Research Conference. 2001. The forkhead domain protein slp1 participates in combinatorial repression of even-skipped stripe 2. p. a37. The Genetics Society of America, Washington, D.C.
- Apostolico A, Bock ME, Lonardi S, Xu X. Efficient detection of unusual words. J Comput Biol. 2000;7:71–94. - PubMed
- Arnosti DN, Barolo S, Levine M, Small S. The eve stripe 2 enhancer employs multiple modes of transcriptional synergy. Development. 1996;122:205–214. - PubMed
- Bailey TL, Elkan C. Fitting a mixture model by expectation maximization to discover motifs in biopolymers. Proc Int Conf Intell Syst Mol Biol. 1994;2:28–36. - PubMed
- ————— Unsupervised learning of multiple motifs in biopolymers using expectation maximization. Machine Learning. 1995;21:51–80.
Publication types
MeSH terms
Substances
LinkOut - more resources
Full Text Sources
Other Literature Sources
Molecular Biology Databases


