Susceptibility to experimental cerebral malaria induced by Plasmodium berghei ANKA in inbred mouse strains recently derived from wild stock - PubMed (original) (raw)
Susceptibility to experimental cerebral malaria induced by Plasmodium berghei ANKA in inbred mouse strains recently derived from wild stock
S Bagot et al. Infect Immun. 2002 Apr.
Abstract
The neurological syndrome caused by Plasmodium berghei ANKA in rodents partially mimics the human disease. Several rodent models of cerebral malaria (CM) exist for the study of the mechanisms that cause the disease. However, since common laboratory mouse strains have limited gene pools, the role of their phenotypic variations causing CM is restricted. This constitutes an obstacle for efficient genetic analysis relating to the pathogenesis of malaria. Most common laboratory mouse strains are susceptible to CM, and the same major histocompatibility complex (MHC) haplotype may exhibit different levels of susceptibility. We analyzed the influence of the MHC haplotype on overcoming CM by using MHC congenic mice with C57BL/10 and C3H backgrounds. No correlation was found between MHC molecules and the development of CM. New wild-derived mouse strains with wide genetic polymorphisms were then used to find new models of resistance to CM. Six of the twelve strains tested were resistant to CM. For two of them, F(1) progeny and backcrosses performed with the reference strain C57BL/6 showed a high level of heterogeneity in the number and characteristics of the genetic factors associated with resistance to CM.
Figures
FIG. 1.
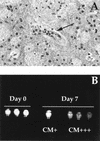
(A) Histopathological studies show typical microvessels with adherent leukocytes (arrow). (B) Evans Blue leakage analysis was performed for control, CM+, and CM+++ C57BL/6 mice infected P. berghei ANKA. CM+ and CM+++ nomenclature was used to define degrees of severity of the neurological syndrome. As exemplified in the picture, CM+ mice showed mild symptoms, whereas CM+++ mice were at the latest stage of the disease.
FIG. 2.
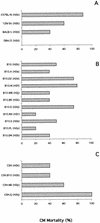
Effects of the genetic background and the MHC haplotype of the host on the incidence of CM. (A) Bar charts show the percentage of mortality from CM of some common strains of laboratory mice: C57BL/6 (n = 19), O129/Sv (n = 12), BALB/c (n = 25), and DBA/2 (n = 25). (B) CM mortality was also studied for MHC congenic C57BL/10 strains (5 to 41 mice per strain). (C) The same study was repeated on MHC congenic C3H strains (5 to 16 mice per strain).
FIG. 3.
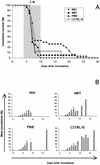
Determination of CM susceptibility for three strains belonging to M. musculus musculus. (A) Survival curves for strains MAI (⧫; 10 females and 9 males), MBT (▪; 10 females and 10 males), and PWK (▴; 14 females and 16 males). The shaded portion represents the time window of mortality from CM for the strains tested. (B) Parasitemia was determined for strains MAI (five males and four females), MBT (five females and five males), and PWK (eight females and six males). Bar charts represent the mean percentage of parasitemia ± the standard deviation. The survival curve (○) and parasitemia of C57BL/6 are included as a reference.
FIG. 4.
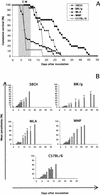
Determination of CM susceptibility for four M. musculus subsp. domesticus strains. (A) Survival curves were constructed for strains 38CH (♦) (4 females and 12 males), BIK/g (▪; 14 females and 17 males), WLA (▴; 11 females and 10 males), and WMP (•; 27 females and 22 males). The shaded portion represents the time window of mortality from CM, which occurred only in WMP and C57BL/6 strains. (B) Parasitemia was determined for strains 38CH (five males), BIK/g (five females and three males), WLA (five females and five males), and WMP (five females and five males). Bar charts represent the mean percentage of parasitemia ± the standard deviation. The survival curve (○) and parasitemia of C57BL/6 are included as a reference.
FIG. 5.
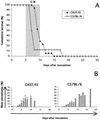
Study of CM susceptibility of M. musculus castaneus (CAST/Ei). (A) Survival curve (▴) and parasitemia (B) were determined with 17 female mice. The shaded portion represents the time window of mortality from CM. Bar charts represent the mean percentage of parasitemia ± the standard deviation. The survival curve (○) and parasitemia of C57BL/6 mice are included as reference.
FIG. 6.
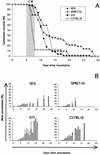
CM susceptibility of three strains belonging to M. spretus. (A) Survival curves were determined for strains SEG (▴; 20 females and 10 males), SPRET/Ei (⧫; 7 females and 3 males), and STF (▪; 39 females and 31 males). (B) Parasitemia was determined for strains SEG (5 females and 3 males), SPRET/Ei (4 females and 5 males), and STF (9 females and 13 males). Bar charts represent the mean percentage of parasitemia ± the standard deviation. The survival curve (○) and parasitemia of C57BL/6 mice are included as reference. The shaded portion represents the time window of mortality from CM for C57BL/6 strain.
FIG. 7.
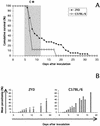
CM susceptibility of ZYD (M. spicilegus). (A) The survival curve (▴) and parasitemia (B) were determined with 17 females. The shaded portion in panel A represents the time window of mortality from CM. Bar charts represent the mean percentage of parasitemia ± the standard deviation. The survival curve (○) and parasitemia of C57BL/6 mice are included as reference.
FIG. 8.
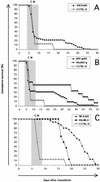
Susceptibility to CM exhibited by (CM-resistant strain × C57BL/6)F1 progenies. Survival curves for F1 crosses with C57BL/6 were performed with strains 38CH (A), BIK/g (B), and WLA (C). A cross between a male from a resistant strain and a female C57BL/6 mouse is indicated by a triangle, and the opposite cross is indicated by a square. Experiments were performed with 45 females and 48 males for (38CH × B6)F1, 26 females and 28 males for (BIK/g × B6)F1, 7 females and 8 males for (B6 × BIK/g)F1, 13 females and 18 males for (WLA × B6)F1, and 8 females for (B6 × WLA)F1. The survival curve (○) of C57BL/6 mice is included as reference. The shaded portion represents the time window of mortality from CM.
FIG. 9.
CM susceptibility of mice resulting from (38CH × B6)F1 progeny backcrossed with 38CH mice (A) and from (WLA × B6)F1 progeny backcrossed with C57BL/6 mice (B). The survival curves for these mice are represented by triangles. The survival curve (○) and parasitemia of C57BL/6 mice are included as a reference. The shaded portions represent death from CM.
Similar articles
- MDR1A (ABCB1)-deficient CF-1 mutant mice are susceptible to cerebral malaria induced by Plasmodium berghei ANKA.
de Lagerie SB, Fernandez C, German-Fattal M, Gantier JC, Gimenez F, Farinotti R. de Lagerie SB, et al. J Parasitol. 2008 Oct;94(5):1139-42. doi: 10.1645/GE-1493.1. J Parasitol. 2008. PMID: 18973419 - Deletion of T cells bearing the V beta8.1 T-cell receptor following mouse mammary tumor virus 7 integration confers resistance to murine cerebral malaria.
Gorgette O, Existe A, Boubou MI, Bagot S, Guénet JL, Mazier D, Cazenave PA, Pied S. Gorgette O, et al. Infect Immun. 2002 Jul;70(7):3701-6. doi: 10.1128/IAI.70.7.3701-3706.2002. Infect Immun. 2002. PMID: 12065512 Free PMC article. - Identification of two cerebral malaria resistance loci using an inbred wild-derived mouse strain.
Bagot S, Campino S, Penha-Gonçalves C, Pied S, Cazenave PA, Holmberg D. Bagot S, et al. Proc Natl Acad Sci U S A. 2002 Jul 23;99(15):9919-23. doi: 10.1073/pnas.152215199. Epub 2002 Jul 11. Proc Natl Acad Sci U S A. 2002. PMID: 12114535 Free PMC article. - Genetic analysis of cerebral malaria in the mouse model infected with Plasmodium berghei.
Torre S, Langlais D, Gros P. Torre S, et al. Mamm Genome. 2018 Aug;29(7-8):488-506. doi: 10.1007/s00335-018-9752-9. Epub 2018 Jun 19. Mamm Genome. 2018. PMID: 29922917 Review. - Pathogenic T cells in cerebral malaria.
Rénia L, Potter SM, Mauduit M, Rosa DS, Kayibanda M, Deschemin JC, Snounou G, Grüner AC. Rénia L, et al. Int J Parasitol. 2006 May 1;36(5):547-54. doi: 10.1016/j.ijpara.2006.02.007. Epub 2006 Mar 10. Int J Parasitol. 2006. PMID: 16600241 Review.
Cited by
- Inflammatory changes in the central nervous system are associated with behavioral impairment in Plasmodium berghei (strain ANKA)-infected mice.
Lacerda-Queiroz N, Rodrigues DH, Vilela MC, Miranda AS, Amaral DC, Camargos ER, Carvalho LJ, Howe CL, Teixeira MM, Teixeira AL. Lacerda-Queiroz N, et al. Exp Parasitol. 2010 Jul;125(3):271-8. doi: 10.1016/j.exppara.2010.02.002. Epub 2010 Feb 6. Exp Parasitol. 2010. PMID: 20138873 Free PMC article. - Differential Effect of Antioxidants Glutathione and Vitamin C on the Hepatic Injuries Induced by Plasmodium berghei ANKA Infection.
Kauffmann N, da Penha LKRL, Braga DV, Ataíde BJA, Mendes NSF, de Sousa LP, da Souza GS, Passos ACF, Batista EJO, Herculano AM, Oliveira KRHM. Kauffmann N, et al. Biomed Res Int. 2021 Sep 4;2021:9694508. doi: 10.1155/2021/9694508. eCollection 2021. Biomed Res Int. 2021. PMID: 34527745 Free PMC article. - Synthetic angiotensin II peptide derivatives confer protection against cerebral and severe non-cerebral malaria in murine models.
Silva AF, Torres MDT, Silva LS, Alves FL, Miranda A, Oliveira VX Jr, de la Fuente-Nunez C, Pinheiro AAS. Silva AF, et al. Sci Rep. 2024 Feb 26;14(1):4682. doi: 10.1038/s41598-024-51267-5. Sci Rep. 2024. PMID: 38409185 Free PMC article. - Metabolic perturbations of kidney and spleen in murine cerebral malaria: (1)H NMR-based metabolomic study.
Ghosh S, Sengupta A, Sharma S, Sonawat HM. Ghosh S, et al. PLoS One. 2013 Sep 6;8(9):e73113. doi: 10.1371/journal.pone.0073113. eCollection 2013. PLoS One. 2013. PMID: 24039868 Free PMC article. - Absence of apolipoprotein E protects mice from cerebral malaria.
Kassa FA, Van Den Ham K, Rainone A, Fournier S, Boilard E, Olivier M. Kassa FA, et al. Sci Rep. 2016 Sep 20;6:33615. doi: 10.1038/srep33615. Sci Rep. 2016. PMID: 27647324 Free PMC article.
References
- Baird, J. K., S. Masbar, H. Basri, S. Tirtokusumo, B. Subianto, and S. L. Hoffman. 1998. Age-dependent susceptibility to severe disease with primary exposure to Plasmodium falciparum. J. Infect. Dis. 178:592-595. - PubMed
- Berendt, A. R., D. L. Simmons, J. Tansey, C. I. Newbold, and K. Marsh. 1989. Intercellular adhesion molecule-1 is an endothelial cell adhesion receptor for Plasmodium falciparum. Nature 341:57-59. - PubMed
- Bonhomme, F., and J.-L. Guenet. 1996. The laboratory mouse and its wild relatives, p. 1577-1596. In M. F. Lyon, S. Rastan, and S. D. M. Brown (ed.), Genetic variants and strains of the laboratory mouse, 3rd ed., vol. 2. Oxford University Press, Oxford, England.
- Boubou, M. I., A. Collette, D. Voegtle, D. Mazier, P. A. Cazenave, and S. Pied. 1999. T cell response in malaria pathogenesis: selective increase in T cells carrying the TCR Vβ8 during experimental cerebral malaria. Int. Immunol. 11:1553-1562. - PubMed
Publication types
MeSH terms
LinkOut - more resources
Full Text Sources
Molecular Biology Databases
Research Materials
