Tau blocks traffic of organelles, neurofilaments, and APP vesicles in neurons and enhances oxidative stress - PubMed (original) (raw)
Tau blocks traffic of organelles, neurofilaments, and APP vesicles in neurons and enhances oxidative stress
K Stamer et al. J Cell Biol. 2002.
Abstract
We studied the effect of microtubule-associated tau protein on trafficking of vesicles and organelles in primary cortical neurons, retinal ganglion cells, and neuroblastoma cells. Tau inhibits kinesin-dependent transport of peroxisomes, neurofilaments, and Golgi-derived vesicles into neurites. Loss of peroxisomes makes cells vulnerable to oxidative stress and leads to degeneration. In particular, tau inhibits transport of amyloid precursor protein (APP) into axons and dendrites, causing its accumulation in the cell body. APP tagged with yellow fluorescent protein and transfected by adenovirus associates with vesicles moving rapidly forward in the axon (approximately 80%) and slowly back (approximately 20%). Both movements are strongly inhibited by cotransfection with fluorescently tagged tau (cyan fluorescent protein-tau) as seen by two-color confocal microscopy. The data suggests a linkage between tau and APP trafficking, which may be significant in Alzheimer's disease.
Figures
Figure 1.
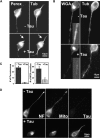
Tau causes the disappearance of vesicles and organelles from neurites. (A) Peroxisomes: N2a cells were differentiated for 2 d by 1 μM retinoic acid, fixed in methanol, and immunostained for peroxisomes (left) and tubulin (right). In mock-transfected controls (top), peroxisomes and MTs are visible in the cell body and throughout the neurite. In cells stably expressing tau (bottom), peroxisomes are mostly absent from the neurites and clustered around the MTOC in the cell body. These cells also have shorter neurites than the controls, but microtubules are still present throughout the neurites. (B) WGA-labeled vesicles: similar experiment as in A but staining with rhodamine-labeled WGA (left). In mock-transfected cells (top), WGA-stained vesicles (presumably Golgi-derived [Gonatas and Avrameas, 1977]) are visible in the cell body and neurite (inset, proximal neurite). In tau stable cells (bottom), the vesicles are strongly reduced in the neurites, and the trans-Golgi network is more contracted in the cell body. (C) Quantitation of the number of peroxisomes (left) and Golgi-derived vesicles (right) in neurites of N2a cells derived from 20-μm stretches of proximal neurites. In tau-stable cells, the density of peroxisomes decreases to ∼6% of the control cells, and the density of vesicles decreases to ∼25% of the control. (D) Disappearance of neurofilaments and mitochondria from neurites of tau-expressing N2a cells. In control N2a cells (top), neurofilaments (left, stained by antibody SMI32) and mitochondria (center, stained by MitoTracker Red) both extend along the entire length of the neurite, whereas tau (right, stained by antibody K9JA) is not visible in the cells because its endogenous concentration is too low. In tau-stable cells (bottom), neurofilaments and mitochondria are strongly reduced in the neurite and clustered in the cell body, whereas tau is visible in both compartments.
Figure 2.
Axons of primary rat neurons transfected by HSV-tau become depleted of mitochondria. (A, top) Rat primary hippocampal neurons contain mitochondria (left, stained with MitoTracker Red) and endogenous tau (right, stained with antibody KJ9A) in the cell body and neurites. (A, bottom) When primary neurons are treated with an HSV vector containing htau40 (transfection rate 75%), the positive cells are strongly stained with the tau antibody (bottom right), and mitochondria largely disappear from the neurites (bottom left, arrowhead). (B) Quantitation of mitochondria (left) and peroxisomes (right) measured in the proximal 50 μm of the neurite. The number of mitochondria decreases approximately ∼3-fold in tau-transfected cells compared with controls, and peroxisomes decrease ∼2.5-fold. The decrease of organelles is even more pronounced in the more distal parts of the neurites. Error bars show SEM; n = 10.
Figure 3.
Neurites of N2a cells overexpressing tau are highly susceptible to oxidative stress. (A, top) Control N2a cells (mock-transfected with vector) differentiated for 2 d and exposed to 250 μM H2O2 for up to 2 h. At 60 min, long neurites (>30 μm) stained for microtubules are less frequent but still clearly visible, and even at 120 min some thin neurites can be discerned. (A, bottom) Tau-stable N2a cells treated with H2O2. Neurites (>30 μm) disappear quickly and are no longer visible at 60 min. (B) Quantitation of oxidative stress by H2O2 and protection by catalase. Differentiated N2a cells (2 d) were treated with 30 μM H2O2, and neurites longer than 30 μm (twice the cell body diameter) were scored. In mock-transfected cells (left group of bars), the fraction of cells with long neurites drops from an initial value of 12.3 to 5.9% (∼ 2-fold) after 40 min of H2O2. In tau-transfected cells, (right group of bars) this fraction drops from an initial 9.9% down to 0.3% (∼33-fold). Adding catalase (0.02 U/μl) but no H2O2 to the medium does not change the number of long neurites (black bars). When catalase is added immediately after H2O2 exposure in control cells, it protects the cells so that 8.7% still have long neurites after 40 min H2O2 treatment compared with only 5.9% without catalase. In the case of tau-overexpressing cells, the fraction of cells with long neurites drops from 9.9 to 0.3% after H2O2 treatment but only to 5.6% with catalase. Thus, the higher vulnerability of neurites in tau-expressing cells can be explained by the lack of peroxisomes carrying catalase. Experiments were done in triplicate, 3 × 150 cells were counted for each condition. Error bars show SEM. (C) Inhibition of catalase exacerbates vulnerability of neurites against H2O2 in controls but not in tau-transfected cells. (Left) Mock-transfected cells differentiated for 2 d: the fraction of cells with long neurites (>30 μm) drops from 11.5% (untreated) to 5.2% after H2O2 treatment (30 μM, 40 min). Inhibition of catalase with 10 mM 3-AT for 60 min causes some degeneration (to 9.0%), but treatment first with 10 mM 3-AT for 60 min and then 30 μm H2O2 for 40 min causes a drop to 2.7%. Thus, the inhibition of catalase enhances the toxic effect of H2O2. (Right) N2a cells stably transfected with tau have a lower initial number of long neurites (8.4%). They are diminished somewhat by 3-AT treatment (to 6.6%) but almost disappear after H2O2 treatment (0.7%). In these conditions, a similar value (0.9%) is observed with 3-AT + H2O2 treatment because the peroxisomes are already excluded from the neurites (which is equivalent to catalase inhibition). Error bars show SEM; n = 300.
Figure 4.
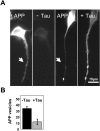
Reduction of APP-containing vesicles in neurites of N2a cells by tau. (A) N2a cells stably overexpressing APP695 were differentiated for 1 d by serum deprivation and 1 μM retinoic acid, and then transiently transfected with htau40 for 12 h. Cells were fixed by methanol and immunostained with antibodies against APP (myc tag) and tau (HA tag). (Left) Control cells without tau transfection show APP in the cell body and along neurites but no staining of tau. (Right) Cells transfected with tau show APP vesicles clustered in the Golgi area but not in the neurite (arrow), whereas tau is present throughout the neurite. (B) Quantitation: the number of APP vesicles stained with an antibody against human APP (B5 5313) in a stretch of 30-μm length drops approximately threefold after expression of tau.
Figure 5.
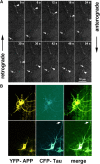
APP-YFP transport in cultured cortical neurons. (A) After 8 d in culture rat, cortical neurons were transfected with APP-YFP AV and analyzed 24 h later by live cell light microscopy. Confocal images were collected in 6-s time frames. The arrowheads and arrows point at two tubular vesicles carrying APP-YFP that move toward each other, crossover at t = 48 s, and continue without interference (velocities: top particle, 0.60 μm/s and bottom particle, 0.36 μm/s). (B) Dual color live imaging of APP and tau in cultured cortical neurons cotransfected with APP-YFP and CFP-htau40 AV and analyzed 24 h later by live cell confocal microscopy. Transfected neuron expressing APP-YFP (top) and doubly transfected neuron expressing APP-YFP and CFP-htau40 (bottom). Note that APP alone distributes throughout the cell body and neurites (top), but with elevated tau it is largely restricted to the cell body (bottom left), whereas tau is visible along the axons (bottom middle, arrow).
Figure 6.
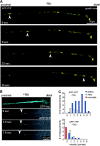
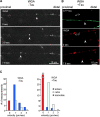
Time-lapse imaging of APP-YFP transport in cultured chick retinal ganglion neurons and inhibition by tau. (A) After 1 d in culture, the RGCs were transfected with APP-YFP AV and analyzed 48 h later (transfection rate 80%). Image frames were collected every 3.9 s. The arrowheads point at an elongated vesicle carrying APP-YFP moving rapidly toward the growth cone on the right (average velocity, 4.5 μm/s; instantaneous velocity, up to 7 μm/s). The particle resides in the growth cone and eventually disappears. (B) Double transfection of RGCs with CFP-htau40 and APP-YFP (30% double transfection). The top shows the blue fluorescence of tau throughout the axon and growth cone, and the bottom shows yellow fluorescent APP vesicles. Very few particles are visible in the presence of tau, and they slowly move in the retrograde direction (0.4 μm/s; arrowheads). (C) Quantification: fractions of particles moving in RGCs transfected with APP only or with APP and tau. Particle movement was classified by direction (anterograde and retrograde) and speed (bins of 1 μm/s). Anterograde vesicles predominate, and speeds can be up to 7 μm/s (clustered particles forming immobile traffic jams were not scored here). After transfection with tau, very few vesicles move, many are immobile (red bar), and slow speeds predominate in both directions.
Figure 7.
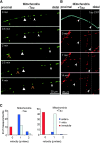
Transport of Golgi-derived vesicles in chick retinal ganglion neurons. The growth cone is on the right (outside the picture frame). (A) After 2 d in culture, RGCs were stained with WGA, and movements of vesicles were monitored by confocal microscopy. The arrowheads point to an example of a retrogradely moving particle at 1.2 μm/s. (B) After 2 d in culture, RGCs were transfected with CFP-tau, and 2 d later they were stained with WGA. The tau-expressing axon (top, blue) contains almost no WGA-stained vesicles; one of the rare retrograde movements is indicated by arrows (0.7 μm/s; middle and bottom). By contrast, the axon not overexpressing tau (double arrows) contain numerous mobile particles. (C) Quantification of WGA vesicle transport without or with tau transfection. WGA particles generally move more slowly than APP vesicles. The distribution between slow and medium velocities (shown in 1 μm/s bins) is roughly comparable without or with tau, but the absolute numbers of moving particles are much smaller after transfection with tau.
Figure 8.
Transport of mitochondria in chick retinal ganglion neurons. The growth cone is on the right (outside the picture frame). (A) After 2 d in culture, RGCs were stained with MitoTracker green, and movements of mitochondria were monitored by confocal microscopy. The triangular arrowhead (middle) points at a nearly immobile particle (with only small excursion in either direction). The slender arrowhead (right) and the open arrowhead show particles with anterograde movement. Average velocities are ∼0.5 μm/s, but instantaneous velocities are ∼1 μm/s. (B) After 2 d in culture, RGCs were transfected with CFP-tau by AV (5 h) and incubated overnight with MitoTracker red and observed 24 h later by confocal microscopy. The tau-expressing axon (top, blue) contains very few mitochondria, which are mostly stationary or gradually move retrogradely (arrowheads). By contrast, the axons not overexpressing tau contain numerous mobile particles. (C) Quantification of mitochondria transport in 1 μm/s bins without or with tau transfection (left and right). Instantaneous velocities are similar in both direction (mostly ∼1 μm/s). Without tau, 20% of the mitochondria are immobile, 55% move anterogradely, and 25% move retrogradely. With tau, this distribution shifts to ∼50% immobile, ∼50% retrograde, and only a small fraction shows anterograde movement.
Similar articles
- Inhibition of APP trafficking by tau protein does not increase the generation of amyloid-beta peptides.
Goldsbury C, Mocanu MM, Thies E, Kaether C, Haass C, Keller P, Biernat J, Mandelkow E, Mandelkow EM. Goldsbury C, et al. Traffic. 2006 Jul;7(7):873-88. doi: 10.1111/j.1600-0854.2006.00434.x. Epub 2006 May 25. Traffic. 2006. PMID: 16734669 - Phosphorylated tau in neuritic plaques of APP(sw)/Tau (vlw) transgenic mice and Alzheimer disease.
Pérez M, Morán MA, Ferrer I, Avila J, Gómez-Ramos P. Pérez M, et al. Acta Neuropathol. 2008 Oct;116(4):409-18. doi: 10.1007/s00401-008-0420-0. Epub 2008 Aug 5. Acta Neuropathol. 2008. PMID: 18679696 - Non-tau based neuronal degeneration in Alzheimer's disease -- an immunocytochemical and quantitative study in the supragranular layers of the middle temporal neocortex.
van de Nes JA, Nafe R, Schlote W. van de Nes JA, et al. Brain Res. 2008 Jun 5;1213:152-65. doi: 10.1016/j.brainres.2008.03.043. Epub 2008 Apr 1. Brain Res. 2008. PMID: 18455153 - Do axonal defects in tau and amyloid precursor protein transgenic animals model axonopathy in Alzheimer's disease?
Götz J, Ittner LM, Kins S. Götz J, et al. J Neurochem. 2006 Aug;98(4):993-1006. doi: 10.1111/j.1471-4159.2006.03955.x. Epub 2006 Jun 19. J Neurochem. 2006. PMID: 16787410 Review. - Subcellular trafficking of the amyloid precursor protein gene family and its pathogenic role in Alzheimer's disease.
Kins S, Lauther N, Szodorai A, Beyreuther K. Kins S, et al. Neurodegener Dis. 2006;3(4-5):218-26. doi: 10.1159/000095259. Neurodegener Dis. 2006. PMID: 17047360 Review.
Cited by
- Di-rectifying Tau.
Jha S, Rasband MN. Jha S, et al. EMBO J. 2011 Nov 30;30(23):4699-700. doi: 10.1038/emboj.2011.409. EMBO J. 2011. PMID: 22126819 Free PMC article. - Activation of the unfolded protein response and granulovacuolar degeneration are not common features of human prion pathology.
Wiersma VI, van Hecke W, Scheper W, van Osch MA, Hermsen WJ, Rozemuller AJ, Hoozemans JJ. Wiersma VI, et al. Acta Neuropathol Commun. 2016 Oct 28;4(1):113. doi: 10.1186/s40478-016-0383-7. Acta Neuropathol Commun. 2016. PMID: 27793194 Free PMC article. - Synaptic alterations in the rTg4510 mouse model of tauopathy.
Kopeikina KJ, Polydoro M, Tai HC, Yaeger E, Carlson GA, Pitstick R, Hyman BT, Spires-Jones TL. Kopeikina KJ, et al. J Comp Neurol. 2013 Apr 15;521(6):1334-53. doi: 10.1002/cne.23234. J Comp Neurol. 2013. PMID: 23047530 Free PMC article. - Physical Exercise and Brain Mitochondrial Fitness: The Possible Role Against Alzheimer's Disease.
Bernardo TC, Marques-Aleixo I, Beleza J, Oliveira PJ, Ascensão A, Magalhães J. Bernardo TC, et al. Brain Pathol. 2016 Sep;26(5):648-63. doi: 10.1111/bpa.12403. Brain Pathol. 2016. PMID: 27328058 Free PMC article. Review. - Untangling Tau and Iron: Exploring the Interaction Between Iron and Tau in Neurodegeneration.
Rao SS, Adlard PA. Rao SS, et al. Front Mol Neurosci. 2018 Aug 17;11:276. doi: 10.3389/fnmol.2018.00276. eCollection 2018. Front Mol Neurosci. 2018. PMID: 30174587 Free PMC article. Review.
References
- Amaratunga, A., and R.E. Fine. 1995. Generation of amyloidogenic C-terminal fragments during rapid axonal transport in vivo of beta-amyloid precursor protein in the optic nerve. J. Biol. Chem. 270:17268–17272. - PubMed
- Amaratunga, A., S.E. Leeman, K.S. Kosik, and R.E. Fine. 1995. Inhibition of kinesin synthesis in vivo inhibits the rapid transport of representative proteins for three transport vesicle classes into the axon. J. Neurochem. 64:2374–2376. - PubMed
- Arriagada, P.V., J.H. Growdon, E.T. Hedley-Whyte, and B.T. Hyman. 1992. Neurofibrillary tangles but not senile plaques parallel duration and severity of Alzheimer's disease. Neurology. 42:631–639. - PubMed
- Baas, P.W. 1999. Microtubules and neuronal polarity: lessons from mitosis. Neuron. 22:23–31. - PubMed
- Banker, G.A., and K. Goslin. 1998. Culturing Nerve Cells. MIT Press, Cambridge, Massachusetts. 666 pp.
Publication types
MeSH terms
Substances
LinkOut - more resources
Full Text Sources
Other Literature Sources
Medical
