Large-scale analysis of the human and mouse transcriptomes - PubMed (original) (raw)
. 2002 Apr 2;99(7):4465-70.
doi: 10.1073/pnas.012025199. Epub 2002 Mar 19.
Michael P Cooke, Keith A Ching, Yaron Hakak, John R Walker, Tim Wiltshire, Anthony P Orth, Raquel G Vega, Lisa M Sapinoso, Aziz Moqrich, Ardem Patapoutian, Garret M Hampton, Peter G Schultz, John B Hogenesch
Affiliations
- PMID: 11904358
- PMCID: PMC123671
- DOI: 10.1073/pnas.012025199
Large-scale analysis of the human and mouse transcriptomes
Andrew I Su et al. Proc Natl Acad Sci U S A. 2002.
Abstract
High-throughput gene expression profiling has become an important tool for investigating transcriptional activity in a variety of biological samples. To date, the vast majority of these experiments have focused on specific biological processes and perturbations. Here, we have generated and analyzed gene expression from a set of samples spanning a broad range of biological conditions. Specifically, we profiled gene expression from 91 human and mouse samples across a diverse array of tissues, organs, and cell lines. Because these samples predominantly come from the normal physiological state in the human and mouse, this dataset represents a preliminary, but substantial, description of the normal mammalian transcriptome. We have used this dataset to illustrate methods of mining these data, and to reveal insights into molecular and physiological gene function, mechanisms of transcriptional regulation, disease etiology, and comparative genomics. Finally, to allow the scientific community to use this resource, we have built a free and publicly accessible website (http://expression.gnf.org) that integrates data visualization and curation of current gene annotations.
Figures
Figure 1
Expression of tissue-specific genes. Genes with tissue-specific expression patterns were identified for all tissues in the human (A) and mouse (B) datasets. “Tissue-specific” was defined as expressed with AD greater than 200 in one tissue and less than 100 AD in all other tissues. Tissues were sorted by the number of tissue-specific genes found. The five tissues in human and mouse with the most tissue-specific genes are labeled. Replicate samples from one tissue were averaged, and genes and tissues were clustered by using
cluster
and visualized by using
treeview
(25). Red, up-regulated; green, down-regulated; black, median expression. Tissue labels: a = testis, b = pancreas, c = liver, d = placenta, e = thymus, f = mammary gland, g = thyroid, and h = salivary gland).
Figure 2
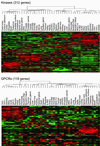
Differential expression of GPCRs and kinases. Pfam was used to identify GPCRs (PF00001, PF00002, and PF00003) and kinases (PF00069, PF00433, PF00454, and PF00625) from the genes interrogated in the gene expression atlas. Data were filtered to remove genes that were not expressed in the atlas (max AD < 200) and not differentially expressed (ANOVA _P_ > 0.05), and the remaining genes were visualized as described previously. The gene identities for these Pfam families, as well as for all Pfam families, can be viewed on the web site (
).
Figure 3
Identification of pituitary-specific response elements. The gene expression atlas was used to identify pituitary-enriched genes (Left). Genomic sequence up to 5 kb upstream of the translational start methionine was searched for conserved motifs. On the Right is a potential regulatory element identified in the upstream genomic sequence of the genes in this cluster. This element is similar to a previously described Pit1 binding site from the growth hormone 2 structural gene.
Figure 4
Potential markers for prostate cancer were identified by comparing gene expression in normal tissues with normal and tumor prostate samples. Fifty candidate makers are visualized here, and the top eight gene identities are shown.
Figure 5
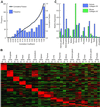
Comparison of gene expression for mouse/human ortholog pairs. Putative ortholog pairs between mouse and human genes were identified by LocusLink symbol. (A) Gene expression patterns across 16 tissues for these 799 gene pairs were compared. The distribution of correlation coefficients is plotted. (B) The 427 gene pairs with correlation coefficients greater than 0.6 were sorted by tissue of maximum expression and visualized as described previously. (C) One hundred twenty-eight gene pairs have negative correlation in their gene expression pattern. The expression pattern for collagen XV is shown here. Mouse collagen XV is highly expressed in the uterus, whereas human collagen XV shows highest expression in the placenta.
Similar articles
- SaVanT: a web-based tool for the sample-level visualization of molecular signatures in gene expression profiles.
Lopez D, Montoya D, Ambrose M, Lam L, Briscoe L, Adams C, Modlin RL, Pellegrini M. Lopez D, et al. BMC Genomics. 2017 Oct 25;18(1):824. doi: 10.1186/s12864-017-4167-7. BMC Genomics. 2017. PMID: 29070035 Free PMC article. - The Plasmodium falciparum sexual development transcriptome: a microarray analysis using ontology-based pattern identification.
Young JA, Fivelman QL, Blair PL, de la Vega P, Le Roch KG, Zhou Y, Carucci DJ, Baker DA, Winzeler EA. Young JA, et al. Mol Biochem Parasitol. 2005 Sep;143(1):67-79. doi: 10.1016/j.molbiopara.2005.05.007. Mol Biochem Parasitol. 2005. PMID: 16005087 - Systematic expression profiling of the mouse transcriptome using RIKEN cDNA microarrays.
Bono H, Yagi K, Kasukawa T, Nikaido I, Tominaga N, Miki R, Mizuno Y, Tomaru Y, Goto H, Nitanda H, Shimizu D, Makino H, Morita T, Fujiyama J, Sakai T, Shimoji T, Hume DA, Hayashizaki Y, Okazaki Y; RIKEN GER Group; GSL Members. Bono H, et al. Genome Res. 2003 Jun;13(6B):1318-23. doi: 10.1101/gr.1075103. Genome Res. 2003. PMID: 12819129 Free PMC article. - Identification of epididymis-specific transcripts in the mouse and rat by transcriptional profiling.
Johnston DS, Turner TT, Finger JN, Owtscharuk TL, Kopf GS, Jelinsky SA. Johnston DS, et al. Asian J Androl. 2007 Jul;9(4):522-7. doi: 10.1111/j.1745-7262.2007.00317.x. Asian J Androl. 2007. PMID: 17589790 Review. - [Transcriptomes for serial analysis of gene expression].
Marti J, Piquemal D, Manchon L, Commes T. Marti J, et al. J Soc Biol. 2002;196(4):303-7. J Soc Biol. 2002. PMID: 12645300 Review. French.
Cited by
- Transcriptomic Characterization of Male Formosan Pangolin (Manis pentadactyla pentadactyla) Reproductive Tract and Evaluation of Domestic Cat (Felis catus) as a Potential Model Species.
Méar LO, Tseng I, Lin KS, Hsu CL, Chen SH, Tsai PS. Méar LO, et al. Animals (Basel). 2024 Sep 6;14(17):2592. doi: 10.3390/ani14172592. Animals (Basel). 2024. PMID: 39272377 Free PMC article. - Synthesis at the Interface of Chemistry and Biology.
Schultz PG. Schultz PG. Acc Chem Res. 2024 Sep 17;57(18):2631-2642. doi: 10.1021/acs.accounts.4c00320. Epub 2024 Aug 28. Acc Chem Res. 2024. PMID: 39198974 Free PMC article. Review. - Coexpression enhances cross-species integration of single-cell RNA sequencing across diverse plant species.
Passalacqua MJ, Gillis J. Passalacqua MJ, et al. Nat Plants. 2024 Jul;10(7):1075-1080. doi: 10.1038/s41477-024-01738-4. Epub 2024 Jun 27. Nat Plants. 2024. PMID: 38937637 Free PMC article. - Oncoprotein SET-associated transcription factor ZBTB11 triggers lung cancer metastasis.
Xu W, Yao H, Wu Z, Yan X, Jiao Z, Liu Y, Zhang M, Wang D. Xu W, et al. Nat Commun. 2024 Feb 14;15(1):1362. doi: 10.1038/s41467-024-45585-5. Nat Commun. 2024. PMID: 38355937 Free PMC article. - TDP-43 and Alzheimer's Disease Pathology in the Brain of a Harbor Porpoise Exposed to the Cyanobacterial Toxin BMAA.
Garamszegi SP, Brzostowicki DJ, Coyne TM, Vontell RT, Davis DA. Garamszegi SP, et al. Toxins (Basel). 2024 Jan 12;16(1):42. doi: 10.3390/toxins16010042. Toxins (Basel). 2024. PMID: 38251257 Free PMC article.
References
- Lander E S, Linton L M, Birren B, Nusbaum C, Zody M C, Baldwin J, Devon K, Dewar K, Doyle M, FitzHugh W, et al. Nature (London) 2001;409:860–921. - PubMed
- Venter J C, Adams M D, Myers E W, Li P W, Mural R J, Sutton G G, Smith H O, Yandell M, Evans C A, Holt R A, et al. Science. 2001;291:1304–1351. - PubMed
- Altschul S F, Gish W, Miller W, Myers E W, Lipman D J. J Mol Biol. 1990;215:403–410. - PubMed
- Eddy S R, Mitchison G, Durbin R. J Comput Biol. 1995;2:9–23. - PubMed
- Burks C, Fickett J W, Goad W B, Kanehisa M, Lewitter F I, Rindone W P, Swindell C D, Tung C S, Bilofsky H S. Comput Appl Biosci. 1985;1:225–233. - PubMed
Publication types
MeSH terms
Substances
LinkOut - more resources
Full Text Sources
Other Literature Sources


