Dynamics of human DNA topoisomerases IIalpha and IIbeta in living cells - PubMed (original) (raw)
Dynamics of human DNA topoisomerases IIalpha and IIbeta in living cells
Morten O Christensen et al. J Cell Biol. 2002.
Abstract
DNA topoisomerase (topo) II catalyses topological genomic changes essential for many DNA metabolic processes. It is also regarded as a structural component of the nuclear matrix in interphase and the mitotic chromosome scaffold. Mammals have two isoforms (alpha and beta) with similar properties in vitro. Here, we investigated their properties in living and proliferating cells, stably expressing biofluorescent chimera of the human isozymes. Topo IIalpha and IIbeta behaved similarly in interphase but differently in mitosis, where only topo IIalpha was chromosome associated to a major part. During interphase, both isozymes joined in nucleolar reassembly and accumulated in nucleoli, which seemed not to involve catalytic DNA turnover because treatment with teniposide (stabilizing covalent catalytic DNA intermediates of topo II) relocated the bulk of the enzymes from the nucleoli to nucleoplasmic granules. Photobleaching revealed that the entire complement of both isozymes was completely mobile and free to exchange between nuclear subcompartments in interphase. In chromosomes, topo IIalpha was also completely mobile and had a uniform distribution. However, hypotonic cell lysis triggered an axial pattern. These observations suggest that topo II is not an immobile, structural component of the chromosomal scaffold or the interphase karyoskeleton, but rather a dynamic interaction partner of such structures.
Figures
Figure 1.
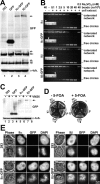
Characterization of HEK 293 cells expressing topo II–GFP. (A) Western analysis of untransfected 293 cells and cells expressing GFP, topo IIα–GFP, or topo IIβ–GFP. Blots were probed with GFP antibodies (top), or antibodies against human topo IIα or IIβ (middle panels), or antibodies against α-tubulin serving as loading control (bottom). Arrowheads on the right margin indicate positions of topo II–GFP chimera. (B) DNA decatenation activity of GFP-fused and endogenous topo II. GFP-directed immunoprecipitates from cells expressing topo IIα–GFP or topo IIβ–GFP and immunoprecipitates from untransfected cells directed at topo IIα or IIβ were subjected to serial dilution and assessed for kDNA decatenation. SDS-PAGE of the immunoprecipitates is shown four times in the inserts with arrowheads identifying those lanes that correspond to the respective decatenation assay. (C) Topo II immunoband depletion assay. The same cell lines as in Fig. 1 A were cultured 1 h in medium containing 200 μM teniposide (+ VM 26) or in plain medium (− VM 26). Cells were then lysed, subjected to Western blotting, and the blots were probed with GFP-antibodies (top). The position of topo II–GFP is indicated on the right margin by an arrowhead. (D) Yeast complementation assay. The S. cerevisiae strain BJ201 carrying a disrupted endogenous TOP2 gene which is substituted by the S. pombe Top2 gene on a URA3-based plasmid, was transformed with LEU2 plasmids carrying either the TPI-promoter alone (−) or TPI-promoted topo II cDNAs encoding topo IIα, topo IIα-GFP, topo IIβ, and topo IIβ–GFP, respectively. After growth on selective plates (without Leu), single clones were streaked on plates with 5-FOA (right) to select for clones that had lost the S. pombe topo II–expressing plasmid. Plates without 5-FOA served as a control (left). Mitotic growth of cells transformed with the topo II expression plasmids on 5-FOA plates indicates that the essential topo II activity is likewise provided by GFP-tagged and untagged versions of human topo II isoforms. (E) Colocalization of GFP fusion proteins with endogenous topo IIα and IIβ by indirect immunofluorescence microscopy. Untransfected 293 cells (top) and topo IIα- (bottom, left) or topo IIβ–GFP-expressing cells (bottom, right) were grown on microscopic slides, PFA-fixed, permeabilized, and double stained with isoform-specific topo II antibodies (columns IIα and β, respectively) and DAPI. Corresponding images of phase contrast (Phase) and green fluorescence (GFP) are shown. From each staining combination one representative cell in interphase (top image) and pro-/metaphase (bottom image) is shown.
Figure 2.
Distribution of topo II–GFP in interphase nuclei. Phase-contrast images and corresponding green fluorescence of living 293 cells expressing topo IIα–GFP (left) and topo IIβ–GFP (right). The insert shows images of selected nucleoli subjected to twofold magnification and contrast enhancement. Arrowheads indicate areas of decreased fluorescence intensity within the nucleoli.
Figure 3.
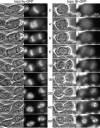
Time-lapse imaging of topo II isoforms during mitosis. Cells expressing either topo IIα–GFP (left) or topo IIβ–GFP (right) were grown on the microscope stage at 37°C and imaged at subsequent time points as indicated. Phase-contrast images and corresponding green fluorescence of representative cells are shown during progression from metaphase to early G1-phase. Video 1 (available at
http://www.jcb.org/cgi/content/full/jcb.200112023/DC1
) shows topo II–GFP-expressing cells proceeding from prophase to early G1-phase. This image series represents a single optical section captured on a confocal microscope at intervals of 30 s.
Figure 4.
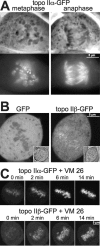
Features of topo II isoforms in mitosis. (A) Centromeric accumulation of topo IIα at metaphase is lost upon transition to anaphase. Topo IIα–GFP-expressing cells were grown on cover slides, then flattened by placing the slide with adherent cells directly onto a glass slide, and imaged directly thereafter. Representative examples of cells at metaphase (left) and anaphase (right) are presented by phase contrast (top) and corresponding green fluorescence of GFP (bottom). Arrowheads indicate an example of centromeric accumulation of topo IIα, as characterized by two pairs of dots per chromosome. (B) Topo IIβ is not excluded from mitotic chromosomes. A single high-resolution, confocal section of metaphase cells expressing either GFP alone (left) or topo IIβ–GFP (right) is shown (inserts: images of transmitted light of the same cells). (C) Topo IIα and topo IIβ accumulate on mitotic chromosomes upon treatment with VM 26. Cells expressing topo IIα–GFP (top) and IIβ–GFP (bottom) were imaged by confocal microscopy before (0 min) and at the indicated time points after the addition of 100 μM VM 26.
Figure 5.
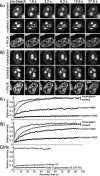
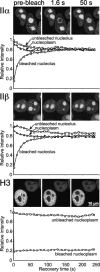
FRAP analysis of topo II–GFP. Cells expressing GFP chimera of topo IIα and IIβ were bleached for 1.8 s. Images were taken before bleaching and at the indicated time points after the end of the bleach pulse. The area to be bleached is indicated by a circle in the prebleach panels. In VM 26–treated cells a nucleolar or a nucleoplasmic region was bleached simultaneously in the same cell, whereas in untreated cells each compartment was bleached in separate cells. Corresponding quantitative data of fluorescence recovery kinetics are plotted below. Fluorescence intensities in the bleached region were measured and expressed as the relative recovery over time. Values represent means from at least six individual cells and three independent experiments. Standard deviations were in each case <5% of the mean values (unpublished data). FRAP kinetics of freely diffusible GFP, chromatin-bound histone H3-GFP and formaldehyde-fixed topo IIβ–GFP served as controls.
Figure 6.
Exchange between nucleoplasmic and nucleolar topo II–GFP. Cells expressing GFP chimera of topo IIα, IIβ, and histone H3, respectively, were bleached and analyzed as in Fig. 5 with two exceptions: (a) A larger area (3 μm diam; white circle) was bleached to achieve a substantial loss of total cellular fluorescence. (b) The relative recovery over time in the bleach spot and the relative loss of fluorescence intensity in unbleached areas (black and white circles) is plotted below each image panel. Plotted data were not corrected for the overall loss of fluorescence induced by the bleach pulse (∼20%), to allow a quantitative comparison of signal loss in unbleached areas with signal gain in the bleached area. For greater clarity, only every tenth data point is marked by a symbol.
Figure 7.
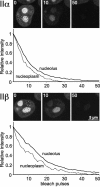
FLIP analysis of interphase topo II–GFP. Nucleoli of cells expressing topo IIα–GFP or topo IIβ–GFP were repeatedly bleached in a circular area (3 μm diam; white circles). Cells were imaged before each new bleach pulse, and fluorescence intensities of neighboring nucleoli and nucleoplasmic areas (black and white circles) were determined. Almost all fluorescence was lost from both compartments after 50 bleach cycles, indicating a high exchange rate between nucleolar and nucleoplasmic topo II.
Figure 8.
Photobleaching experiments on mitotic chromosomes. (A) FRAP (as described in Fig. 5) of metaphase chromosomes in cells expressing GFP chimera of topo IIα (with and without 100 μM VM 26), topo IIβ (VM 26-treated) or histone H3 after bleaching a circular area of 3 μm diam. Bleaching of topo IIβ–GFP-labeled chromosomes not treated with VM 26 was not possible, as they were obscured by large amounts of cytosolic topo IIβ–GFP (Figs. 3 and 4 B). (B) FLIP (as described in Fig. 7) of a chromosomal and a cytoplasmic region (black and white circles) after bleaching of another chromosomal area (white circle) in a metaphase cell expressing topo IIα–GFP.
Figure 9.
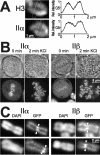
Chromosomal distribution of topo II. (A) Single chromosomes in living metaphase cells expressing topo IIα–GFP or GFP-histone H3 were imaged by high resolution confocal microscopy. Distribution of fluorescence intensity was quantified in the boxed cross sections of the chromosomes. Mean fluorescence intensity of pixel columns across the short diameter of the boxes was normalized to maximal values, and plotted against corresponding distances measured across the long diameter of the boxes (right). (B) Effect of hypotonic treatment on topo II distribution in metaphase. Two cells expressing topo IIα–GFP or topo IIβ–GFP were imaged by confocal microscopy before (0 min) and 2 min after exchanging the medium for KCl solution (75 mM). Images of transmitted light are shown above a corresponding confocal section showing green fluorescence of the same cell. Note the substantial increase in size of KCl-treated cells. (C) Subchromosomal distribution and stability of topo II isoforms in unfixed, spread chromosomes. Cells expressing topo IIα–GFP or topo IIβ–GFP were harvested, collected by centrifugation, swollen in hypotonic solution, and spotted on glass slides without fixation. Spread chromosomes were mounted in DAPI-containing CSK buffer and imaged either immediately (top) or 2 h later (bottom) using filter sets for the specific detection of the DNA stain (DAPI) and the green fluorescence (GFP), respectively. Arrowheads mark the position of centromere pairs.
Similar articles
- Association of human DNA topoisomerase IIalpha with mitotic chromosomes in mammalian cells is independent of its catalytic activity.
Mo YY, Beck WT. Mo YY, et al. Exp Cell Res. 1999 Oct 10;252(1):50-62. doi: 10.1006/excr.1999.4616. Exp Cell Res. 1999. PMID: 10502399 - Functional compatibility between isoform alpha and beta of type II DNA topoisomerase.
Sakaguchi A, Kikuchi A. Sakaguchi A, et al. J Cell Sci. 2004 Mar 1;117(Pt 7):1047-54. doi: 10.1242/jcs.00977. J Cell Sci. 2004. PMID: 14996935 - Sequence determinants of nuclear localization in the alpha and beta isoforms of human topoisomerase II.
Mirski SE, Gerlach JH, Cole SP. Mirski SE, et al. Exp Cell Res. 1999 Sep 15;251(2):329-39. doi: 10.1006/excr.1999.4587. Exp Cell Res. 1999. PMID: 10471318 - The role of topoisomerase IIalpha and HER-2 in predicting sensitivity to anthracyclines in breast cancer patients.
Oakman C, Moretti E, Galardi F, Santarpia L, Di Leo A. Oakman C, et al. Cancer Treat Rev. 2009 Dec;35(8):662-7. doi: 10.1016/j.ctrv.2009.08.006. Epub 2009 Sep 15. Cancer Treat Rev. 2009. PMID: 19758759 Review. - The roles of DNA topoisomerase II during the cell cycle.
Larsen AK, Skladanowski A, Bojanowski K. Larsen AK, et al. Prog Cell Cycle Res. 1996;2:229-39. doi: 10.1007/978-1-4615-5873-6_22. Prog Cell Cycle Res. 1996. PMID: 9552399 Review.
Cited by
- Regulation of the mitotic chromosome folding machines.
Dekker B, Dekker J. Dekker B, et al. Biochem J. 2022 Oct 28;479(20):2153-2173. doi: 10.1042/BCJ20210140. Biochem J. 2022. PMID: 36268993 Free PMC article. - C-terminal regions of topoisomerase IIalpha and IIbeta determine isoform-specific functioning of the enzymes in vivo.
Linka RM, Porter AC, Volkov A, Mielke C, Boege F, Christensen MO. Linka RM, et al. Nucleic Acids Res. 2007;35(11):3810-22. doi: 10.1093/nar/gkm102. Epub 2007 May 25. Nucleic Acids Res. 2007. PMID: 17526531 Free PMC article. - Localization and dynamics of small circular DNA in live mammalian nuclei.
Mearini G, Nielsen PE, Fackelmayer FO. Mearini G, et al. Nucleic Acids Res. 2004 May 11;32(8):2642-51. doi: 10.1093/nar/gkh587. Print 2004. Nucleic Acids Res. 2004. PMID: 15141035 Free PMC article. - A role of topoisomerase II in linking DNA replication to chromosome condensation.
Cuvier O, Hirano T. Cuvier O, et al. J Cell Biol. 2003 Mar 3;160(5):645-55. doi: 10.1083/jcb.200209023. Epub 2003 Feb 25. J Cell Biol. 2003. PMID: 12604590 Free PMC article. - The Ins and Outs of Aurora B Inner Centromere Localization.
Hindriksen S, Lens SMA, Hadders MA. Hindriksen S, et al. Front Cell Dev Biol. 2017 Dec 22;5:112. doi: 10.3389/fcell.2017.00112. eCollection 2017. Front Cell Dev Biol. 2017. PMID: 29312936 Free PMC article. Review.
References
- Adachi, Y., M. Luke, and U.K. Laemmli. 1991. Chromosome assembly in vitro: topoisomerase II is required for condensation. Cell. 64:137–148. - PubMed
- Austin, C.A., and K.L. Marsh. 1998. Eukaryotic DNA topoisomerase IIβ. Bioessays. 20:215–226. - PubMed
Publication types
MeSH terms
Substances
LinkOut - more resources
Full Text Sources
Other Literature Sources
Molecular Biology Databases
