Cell cycle status affects coxsackievirus replication, persistence, and reactivation in vitro - PubMed (original) (raw)
Cell cycle status affects coxsackievirus replication, persistence, and reactivation in vitro
Ralph Feuer et al. J Virol. 2002 May.
Abstract
Enteroviral persistence has been implicated in the pathogenesis of several chronic human diseases, including dilated cardiomyopathy, insulin-dependent diabetes mellitus, and chronic inflammatory myopathy. However, these viruses are considered highly cytolytic, and it is unclear what mechanisms might permit their long-term survival. Here, we describe the generation of a recombinant coxsackievirus B3 (CVB3) expressing the enhanced green fluorescent protein (eGFP), which we used to mark and track infected cells in vitro. Following exposure of quiescent tissue culture cells to either wild-type CVB3 or eGFP-CVB3, virus production was very limited but increased dramatically after cells were permitted to divide. Studies with cell cycle inhibitors revealed that cells arrested at the G(1) or G(1)/S phase could express high levels of viral polyprotein and produced abundant infectious virus. In contrast, both protein expression and virus yield were markedly reduced in quiescent cells (i.e., cells in G(0)) and in cells blocked at the G(2)/M phase. Following infection with eGFP-CVB3, quiescent cells retained viral RNA for several days in the absence of infectious virus production. Furthermore, RNA extracted from nonproductive quiescent cells was infectious when transfected into dividing cells, indicating that CVB3 appears to be capable of establishing a latent infection in G(0) cells, at least in tissue culture. Finally, wounding of infected quiescent cells resulted in viral protein expression limited to cells in and adjacent to the lesion. We suggest that (i) cell cycle status determines the distribution of CVB3 during acute infection and (ii) the persistence of CVB3 in vivo may rely on infection of quiescent (G(0)) cells incapable of supporting viral replication; a subsequent change in the cell cycle status may lead to virus reactivation, triggering chronic viral and/or immune-mediated pathology in the host.
Figures
FIG. 1.
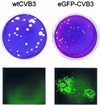
Comparison of plaques formed by wtCVB3 and eGFP-CVB3. HeLa RW cells were infected with the indicated viruses, and 24 h later the cells were evaluated by fluorescence microscopy (lower row). At 48 h postinfection the monolayers were fixed, and plaques were visualized by crystal violet staining (upper row).
FIG. 2.
Serum-depleted cells are quiescent and fail to express CVB3 polyprotein. HeLa RW cells were grown for 24 h in medium with the indicated concentrations of FBS and then infected with eGFP-CVB3 (MOI = 0.1). The infected cells were incubated for 16 h in the indicated medium, fixed, and observed under a fluorescence microscope (left panels). All images are shown at ×31 magnification. For each sample, duplicate cells were harvested and evaluated by flow cytometry (middle panels). The intensity of fluorescence (arbitrary units, log10 scale) is shown, and the dotted line represents a level of fluorescence 10-fold greater than the mean fluorescence of cells grown in 10% FBS. In each population, the percentage of cells showing fluorescence above this level is indicated. To identify the cell cycle status of the cells grown in the different serum concentrations, cells were stained with propidium iodide (P.I.) and analyzed by flow cytometry; the results are shown at the right-hand side of the figure.
FIG. 3.
CVB3 polyprotein expression varies markedly depending on cell cycle status. HeLa RW cells were treated for 16 h with the indicated cell cycle inhibitor [rapamycin (Rap), mimosine (Mim), hydroxyurea (HyU), aphidicolin (Aph), nocodazole (Noc), or taxol (Tax)] and then infected with eGFP-CVB3 (MOI = 0.1). Medium (plus inhibitors) was restored, and the infected cells were incubated for a further 20 h, fixed, and observed under a fluorescence microscope. A representative field is shown for one inhibitor at each stage of cell cycle arrest (left panels). All images are shown at ×31 magnification. In addition, for each sample, cells were harvested at 16 h and evaluated by flow cytometry. Histograms are shown for all inhibitors used (middle panels). At each stage of the cell cycle, the drug named above the arrow correlates with the thin line/filled curve, and the drug named below the arrow corresponds to the thick line; and for each inhibitor, the percentage of fluorescent cells is indicated. A diagram of the cell cycle (∼24 h for human cells) is included, and the stages at which the cells are arrested are shown to the left of each row. To ensure that the cell cycle inhibitors were having the expected effects, inhibitor-treated cells were stained with propidium iodide (P.I.) and analyzed by flow cytometry; the results for one inhibitor of each class are shown at the right-hand side of the figure. Similar results were obtained for the other drug of each pair.
FIG. 4.
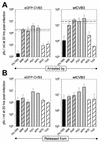
Production of infectious CVB3 is cell cycle dependent. HeLa RW cells were grown to 70% confluence in complete medium and then for 16 h in the presence of the indicated cell cycle inhibitor. G0 cells were obtained by growing cells in medium with 0% FBS. Cells were infected with eGFP-CVB3 or wtCVB3 (MOI = 0.1) for 1 h, washed with saline solution, and given either appropriate medium to maintain their arrested cell cycle status (A) or complete medium without inhibitors to allow cycling (B). Then, 20 h later, viral titers were determined from supernatants. All experiments were carried out in triplicate for each drug and time point, and error bars represent the standard deviation. Bars are coded according to the stage of cell cycle arrest: black, G0; grey hatched, G1; grey, G1/S; hatched, G2/M. For comparative purposes, both viruses were also grown in cycling cells (i.e., with 10% FBS) and harvested after 20 h. The average titers (dashed lines) and standard deviations (dotted lines) are included in the charts in panel A. See the legend to Fig. 3 for abbreviations.
FIG. 5.
CVB latency in and reactivation from quiescent tissue culture cells. Cells were grown for 24 h in serum-free medium, infected with eGFP-CVB3 (MOI = 0.1), and washed. The infected cells were then grown in serum-free medium for 0, 1, 2, or 3 days (the four rows in each data set), after which times the serum-free medium was replaced by either fresh serum-free medium (upper data set) or complete medium (lower data set). Then, 24 h later, the cells were evaluated for eGFP expression and for virus production. For clarity, the experimental procedures are shown in diagrammatic form. Each rectangle represents the addition of fresh medium. Hatched rectangles indicate incubation in serum-free medium, and solid rectangles indicate complete medium. For each time point in both data sets, the percentage of cells expressing eGFP and the virus titers (PFU per milliliter) are tabulated. All samples were evaluated in triplicate; values shown are the means. For sample a, virus was detected in only one of the triplicates. UN, undetectable.
FIG. 6.
CVB3 RNA is present 3 days after infection of quiescent cells despite lack of eGFP expression or virus production. RT-PCR was performed on RNA isolated from cells infected with eGFP-CVB3 and maintained in DMEM without FBS for the indicated amount of time before replacement of medium (addition of complete DMEM or serum-free DMEM for an additional 24 h). Triplicate samples of cells from each time point of the experiment diagrammed in Fig. 5 were pooled, RNA was prepared, and an aliquot was analyzed by RT-PCR. Products are shown from RT-PCRs using primers to detect genomic CVB RNA. For each RNA sample, the eGFP expression and virus production in the source cells (data from Fig. 5) are indicated by + or −. The day 21 RNA was derived from cells which were infected, grown for 3 days in serum-free medium, then given complete medium, and passaged twice until day 21 postinfection. Lane M, DNA size markers.
FIG. 7.
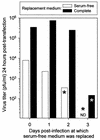
RNA extracted from nonproductive quiescent cells is infectious when transfected into dividing cells. An aliquot of each of the pooled RNA samples described for Fig. 6 was transfected into cycling tissue culture cells. Then, 24 h later, supernatants were collected, and virus titers were determined. Asterisks indicate RNA samples purified from cell populations which did not produce detectable quantities of infectious virus (as determined by plaque assay, Fig. 5). ND, not determined (see text).
FIG. 8.
Viral protein expression in contact-inhibited cells is upregulated by wounding. HeLa RW cells were plated at high density on a chamber slide and grown for 2 days. (A) The confluent monolayer was infected with eGFP-CVB3 for 1 h, washed with saline solution, and either wounded immediately after infection by drawing a pipette tip across the cells (0 h, left photograph) or wounded 12 h after infection (center photograph). eGFP expression in the two scratched areas and in a region located distant from a scratched area (right photograph) was recorded at 24 h postinfection. (B) The confluent monolayer was scratched and 12 h later was infected with eGFP-CVB3. After infection, an agarose-complete medium overlay was added to the chamber, and at the indicated time points thereafter, eGFP expression was assessed. Arrows indicate the direction of wounding.
Similar articles
- Coxsackievirus replication and the cell cycle: a potential regulatory mechanism for viral persistence/latency.
Feuer R, Mena I, Pagarigan RR, Hassett DE, Whitton JL. Feuer R, et al. Med Microbiol Immunol. 2004 May;193(2-3):83-90. doi: 10.1007/s00430-003-0192-z. Epub 2003 Aug 19. Med Microbiol Immunol. 2004. PMID: 12925877 - Coxsackievirus preferentially replicates and induces cytopathic effects in undifferentiated neural progenitor cells.
Tsueng G, Tabor-Godwin JM, Gopal A, Ruller CM, Deline S, An N, Frausto RF, Milner R, Crocker SJ, Whitton JL, Feuer R. Tsueng G, et al. J Virol. 2011 Jun;85(12):5718-32. doi: 10.1128/JVI.02261-10. Epub 2011 Apr 6. J Virol. 2011. PMID: 21471247 Free PMC article. - Using recombinant coxsackievirus B3 to evaluate the induction and protective efficacy of CD8+ T cells during picornavirus infection.
Slifka MK, Pagarigan R, Mena I, Feuer R, Whitton JL. Slifka MK, et al. J Virol. 2001 Mar;75(5):2377-87. doi: 10.1128/JVI.75.5.2377-2387.2001. J Virol. 2001. PMID: 11160741 Free PMC article. - Coxsackievirus B3 replication and pathogenesis.
Garmaroudi FS, Marchant D, Hendry R, Luo H, Yang D, Ye X, Shi J, McManus BM. Garmaroudi FS, et al. Future Microbiol. 2015;10(4):629-53. doi: 10.2217/fmb.15.5. Future Microbiol. 2015. PMID: 25865198 Review. - Preferential coxsackievirus replication in proliferating/activated cells: implications for virus tropism, persistence, and pathogenesis.
Feuer R, Whitton JL. Feuer R, et al. Curr Top Microbiol Immunol. 2008;323:149-73. doi: 10.1007/978-3-540-75546-3_7. Curr Top Microbiol Immunol. 2008. PMID: 18357769 Review.
Cited by
- TMEM41B is a pan-flavivirus host factor.
Hoffmann HH, Schneider WM, Rozen-Gagnon K, Miles LA, Schuster F, Razooky B, Jacobson E, Wu X, Yi S, Rudin CM, MacDonald MR, McMullan LK, Poirier JT, Rice CM. Hoffmann HH, et al. bioRxiv [Preprint]. 2020 Oct 11:2020.10.09.334128. doi: 10.1101/2020.10.09.334128. bioRxiv. 2020. PMID: 33052348 Free PMC article. Updated. Preprint. - Enterovirus 71 mediates cell cycle arrest in S phase through non-structural protein 3D.
Yu J, Zhang L, Ren P, Zhong T, Li Z, Wang Z, Li J, Liu X, Zhao K, Zhang W, Yu XF. Yu J, et al. Cell Cycle. 2015;14(3):425-36. doi: 10.4161/15384101.2014.980631. Cell Cycle. 2015. PMID: 25659038 Free PMC article. - The role of autophagy during coxsackievirus infection of neural progenitor and stem cells.
Tabor-Godwin JM, Tsueng G, Sayen MR, Gottlieb RA, Feuer R. Tabor-Godwin JM, et al. Autophagy. 2012 Jun;8(6):938-53. doi: 10.4161/auto.19781. Epub 2012 Jun 1. Autophagy. 2012. PMID: 22751470 Free PMC article. - Anti-viral triterpenes: a review.
Darshani P, Sen Sarma S, Srivastava AK, Baishya R, Kumar D. Darshani P, et al. Phytochem Rev. 2022;21(6):1761-1842. doi: 10.1007/s11101-022-09808-1. Epub 2022 Mar 5. Phytochem Rev. 2022. PMID: 35283698 Free PMC article. Review. - Viral persistence and chronic immunopathology in the adult central nervous system following Coxsackievirus infection during the neonatal period.
Feuer R, Ruller CM, An N, Tabor-Godwin JM, Rhoades RE, Maciejewski S, Pagarigan RR, Cornell CT, Crocker SJ, Kiosses WB, Pham-Mitchell N, Campbell IL, Whitton JL. Feuer R, et al. J Virol. 2009 Sep;83(18):9356-69. doi: 10.1128/JVI.02382-07. Epub 2009 Jul 1. J Virol. 2009. PMID: 19570873 Free PMC article.
References
- Adachi, K., A. Muraishi, Y. Seki, K. Yamaki, and M. Yoshizuka. 1996. Coxsackievirus B3 genomes detected by polymerase chain reaction: evidence of latent persistency in the myocardium in experimental murine myocarditis. Histol. Histopathol. 11:587-596. - PubMed
- Archard, L. C., N. E. Bowles, L. Cunningham, C. A. Freeke, E. G. Olsen, M. L. Rose, B. Meany, H. J. Why, and P. J. Richardson. 1991. Molecular probes for detection of persisting enterovirus infection of human heart and their prognostic value. Eur. Heart J. 12(Suppl. D):56-59. - PubMed
- Badorff, C., G.-H. Lee, B. J. Lamphear, M. E. Martone, K. P. Campbell, R. E. Rhoads, and K. U. Knowlton. 1999. Enteroviral protease 2A cleaves dystrophin: Evidence of cytoskeletal disruption in an acquired cardiomyopathy. Nat. Med. 5:320-326. - PubMed
- Beltrami, A. P., K. Urbanek, J. Kajstura, S. M. Yan, N. Finato, R. Bussani, B. Nadal-Ginard, F. Silvestri, A. Leri, C. A. Beltrami, and P. Anversa. 2001. Evidence that human cardiac myocytes divide after myocardial infarction. N. Engl. J. Med. 344:1750-1757. - PubMed
- Bendig, J. W. A., P. S. O'Brien, P. Muir, H. J. Porter, and E. O. Caul. 2001. Enterovirus sequences resembling coxsackievirus A2 detected in stool and spleen from a girl with fatal myocarditis. J. Med. Virol. 64:482-486. - PubMed
Publication types
MeSH terms
Substances
LinkOut - more resources
Full Text Sources
Other Literature Sources


