Levels of nonphosphorylated and phosphorylated tau in cerebrospinal fluid of Alzheimer's disease patients : an ultrasensitive bienzyme-substrate-recycle enzyme-linked immunosorbent assay - PubMed (original) (raw)
Levels of nonphosphorylated and phosphorylated tau in cerebrospinal fluid of Alzheimer's disease patients : an ultrasensitive bienzyme-substrate-recycle enzyme-linked immunosorbent assay
Yuan Yuan Hu et al. Am J Pathol. 2002 Apr.
Abstract
We have developed an ultrasensitive bienzyme-substrate-recycle enzyme-linked immunosorbent assay for the measurement of Alzheimer's disease (AD) abnormally hyperphosphorylated tau in cerebrospinal fluid (CSF). The assay, which recognizes attomolar amounts of tau, is approximately 400 and approximately 1300 times more sensitive than conventional enzyme-linked immunosorbent assay in determining the hyperphosphorylated tau and total tau, respectively. With this method, we measured both total tau and tau phosphorylated at Ser-396/Ser-404 in lumbar CSFs from AD and control patients. We found that the total tau was 215 +/- 77 pg/ml in cognitively normal control (n = 56), 234 +/- 92 pg/ml in non-AD neurological (n = 37), 304 +/- 126 pg/ml in vascular dementia (n = 46), and 486 +/- 168 pg/ml (n = 52) in AD patients, respectively. However, a remarkably elevated level in phosphorylated tau was only found in AD (187 +/- 84 pg/ml), as compared with normal controls (54 +/- 33 pg/ml), non-AD (63 +/- 34 pg/ml), and vascular dementia (72 +/- 33 pg/ml) groups. If we used the ratio of hyperphosphorylated tau to total tau of > or =0.33 as cutoff for AD diagnosis, we could confirm the diagnosis in 96% of the clinically diagnosed patients with a specificity of 95%, 86%, 100%, and 94% against nonneurological, non-AD neurological, vascular dementia, and all of the three control groups combined, respectively. It is suggested that the CSF level of tau phosphorylated at Ser-396/Ser-404 is a promising diagnostic marker of AD.
Figures
Figure 1.
Diagram showing the principle of the bienzyme-substrate-recycle ELISA. Alkaline phosphatase, which is linked to secondary antibody, dephosphorylates NADP+ to NAD+. Then, NAD+ enters a highly NAD+-specific redox cycle, in which NAD+ is reduced to NADH by alcohol dehydrogenase, and the NADH produced is oxidized back to NAD+ by diaphorase with the concomitant reduction of resazurin (a nonfluorescent substrate) to resorufin (a fluorescent product). The resorufin accumulates with each cycle of NAD+-NADH-NAD+ and the fluorescence of resorufin is measured at 560 nm excitation and 590 nm emission.
Figure 2.
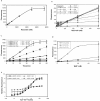
Optimization of the bienzyme-substrate-recycle ELISA. a: Linearity of resorufin fluorescence (standard curve) at 560 nm excitation and 590 nm emission. b: Quenching effect of different concentrations of resazurin at various concentrations of resorufin. A resazurin concentration of 8 μmol/L was found to be optimal. c: Concentration match for di-substrates, resazurin, and NAD+ at an alcohol dehydrogenase to diaphorase ratio of 0.5 U to 0.0125 U: the time kinetics of the generation of resorufin at 8 μmol/L of resazurin and different concentrations of NAD+; under these conditions 100 nmol/L of NAD+ resulted in largest linear range of the time of incubation. d: Units match for bienzyme: the generation of resorufin at different concentrations of NAD+ and at different ratios of alcohol dehydrogenase to diaphorase after incubation for 30 minutes; the ratio of 0.5 U to 0.0125 U was found to be optimal. e: Generation of resorufin at different concentrations of alkaline phosphatase (ALP) and of NADP+; at 1 μmol/L of NADP+ high sensitivity and wide linear range of ALP were achieved. In e the generation of resorufin fluorescence is shown as relative fluorescence, which is the logarithm value of the original fluorescence observed. It may be noted that background increased with an increase in NADP+ concentration. Not shown in this figure when the background was subtracted, at 1 μmol/L of NADP+ concentration, fluorescence of ∼20 and a relative fluorescence linear range of 0 to 3 were obtained.
Figure 3.
Standard curves of recombinant tau and AD P-tau analyzed by the bienzyme-substrate-recycle ELISA and by conventional ELISA. The sensitivity and linear range for recombinant tau (a) and AD P-tau (b) were 1 ng to 32 ng and 0.2 ng to 10 ng, respectively, by conventional ELISA, and 0.75 pg to 200 pg for recombinant tau (c) and 0.5 pg to 50 pg for AD P-tau (d) by bienzyme-substrate-recycle ELISA.
Figure 4.
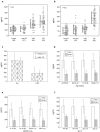
CSF levels of total tau and P-tau as determined by bienzyme-substrate-recycle ELISA. The level of total tau in AD was significantly higher than normal control, non-AD, and VaD, and it was significantly higher in VaD than normal control (a). A significant increase in P-tau was only seen in AD but not in VaD CSF (b). Correlation analysis (not shown) of tau or P-tau of AD patients from The Netherlands Brain Bank with sex (c), age (d), MMSE score (e), and ApoE genotype (f) revealed no correlation with any one of these parameters. Because patients from teaching hospitals in China were assessed by different mental performance tests at each hospital, and these patients were not ApoE genotyped, they were not included in the correlation analysis.
Figure 5.
CSF levels of P-tau normalized against levels of total tau (P-tau to t-tau ratio). The rest of the details are same as in Figure 4 ▶ . The P-tau to t-tau ratio in AD CSF was significantly higher than each of the three control groups and as well as the control groups combined as one group (P < 0.01). The diagnostic value of P-tau to t-tau ratio at ≥0.33 as cutoff for AD had a sensitivity of 96% and specificity of 95%, 86%, 100%, and 94% in comparison with N. cont., non-AD, VaD, and all controls combined, respectively (see Table 2 ▶ ).
Similar articles
- Assessment of cerebrospinal fluid (CSF) beta-amyloid (1-42), phosphorylated tau (ptau-181) and total Tau protein in patients with Alzheimer's disease (AD) and other dementia at Siriraj Hospital, Thailand.
Thaweepoksomboon J, Senanarong V, Poungvarin N, Chakorn T, Siwasariyanon N, Washirutmangkur L, Udompunthuruk S. Thaweepoksomboon J, et al. J Med Assoc Thai. 2011 Feb;94 Suppl 1:S77-83. J Med Assoc Thai. 2011. PMID: 21721431 - [Diagnostic value of tau in cerebrospinal fluid in alzheimer disease].
Hu Y, He S, Wang J. Hu Y, et al. Zhonghua Yi Xue Za Zhi. 2001 Nov 25;81(22):1377-9. Zhonghua Yi Xue Za Zhi. 2001. PMID: 11930632 Chinese. - Measurement of phosphorylated tau epitopes in the differential diagnosis of Alzheimer disease: a comparative cerebrospinal fluid study.
Hampel H, Buerger K, Zinkowski R, Teipel SJ, Goernitz A, Andreasen N, Sjoegren M, DeBernardis J, Kerkman D, Ishiguro K, Ohno H, Vanmechelen E, Vanderstichele H, McCulloch C, Moller HJ, Davies P, Blennow K. Hampel H, et al. Arch Gen Psychiatry. 2004 Jan;61(1):95-102. doi: 10.1001/archpsyc.61.1.95. Arch Gen Psychiatry. 2004. PMID: 14706948 - Simultaneous analysis of cerebrospinal fluid biomarkers using microsphere-based xMAP multiplex technology for early detection of Alzheimer's disease.
Kang JH, Vanderstichele H, Trojanowski JQ, Shaw LM. Kang JH, et al. Methods. 2012 Apr;56(4):484-93. doi: 10.1016/j.ymeth.2012.03.023. Epub 2012 Apr 6. Methods. 2012. PMID: 22503777 Review. - Advances in the development of biomarkers for Alzheimer's disease: from CSF total tau and Abeta(1-42) proteins to phosphorylated tau protein.
Hampel H, Goernitz A, Buerger K. Hampel H, et al. Brain Res Bull. 2003 Aug 15;61(3):243-53. doi: 10.1016/s0361-9230(03)00087-x. Brain Res Bull. 2003. PMID: 12909294 Review.
Cited by
- Antibody-free measurement of cerebrospinal fluid tau phosphorylation across the Alzheimer's disease continuum.
Gobom J, Benedet AL, Mattsson-Carlgren N, Montoliu-Gaya L, Schultz N, Ashton NJ, Janelidze S, Servaes S, Sauer M, Pascoal TA, Karikari TK, Lantero-Rodriguez J, Brinkmalm G, Zetterberg H, Hansson O, Rosa-Neto P, Blennow K. Gobom J, et al. Mol Neurodegener. 2022 Dec 12;17(1):81. doi: 10.1186/s13024-022-00586-0. Mol Neurodegener. 2022. PMID: 36510321 Free PMC article. - Nature of Tau-Associated Neurodegeneration and the Molecular Mechanisms.
Yang Y, Wang JZ. Yang Y, et al. J Alzheimers Dis. 2018;62(3):1305-1317. doi: 10.3233/JAD-170788. J Alzheimers Dis. 2018. PMID: 29562535 Free PMC article. Review. - Novel Phospho-Tau Monoclonal Antibody Generated Using a Liposomal Vaccine, with Enhanced Recognition of a Conformational Tauopathy Epitope.
Theunis C, Adolfsson O, Crespo-Biel N, Piorkowska K, Pihlgren M, Hickman DT, Gafner V, Borghgraef P, Devijver H, Pfeifer A, Van Leuven F, Muhs A. Theunis C, et al. J Alzheimers Dis. 2017;56(2):585-599. doi: 10.3233/JAD-160695. J Alzheimers Dis. 2017. PMID: 28035925 Free PMC article. - CSF phospho-tau correlates with behavioural decline and brain insoluble phospho-tau levels in a rat model of tauopathy.
Zilka N, Korenova M, Kovacech B, Iqbal K, Novak M. Zilka N, et al. Acta Neuropathol. 2010 Jun;119(6):679-87. doi: 10.1007/s00401-010-0680-3. Epub 2010 Apr 9. Acta Neuropathol. 2010. PMID: 20379729 Free PMC article. - Plasma neuronal exosomal levels of Alzheimer's disease biomarkers in normal aging.
Abner EL, Jicha GA, Shaw LM, Trojanowski JQ, Goetzl EJ. Abner EL, et al. Ann Clin Transl Neurol. 2016 Apr 13;3(5):399-403. doi: 10.1002/acn3.309. eCollection 2016 May. Ann Clin Transl Neurol. 2016. PMID: 27231710 Free PMC article.
References
- Growdon JH: Biomarkers of Alzheimer disease. Arch Neurol 1999, 56:281-283 - PubMed
- Garlind A, Brauner A, Hojeberg B, Basun H, Schultzberg M: Soluble interleukin-1 receptor type II levels are elevated in cerebral fluid in Alzheimer disease. Brain Res 1999, 826:112-116 - PubMed
- Galasko D: Cerebrospinal fluid opens a window on Alzheimer disease. Arch Neurol 1999, 56:655-656 - PubMed
- Hock C, Heese K, Muller-Spahn F, Huber P, Riesen W, Nitsch RM, Otten U: Increased CSF level of never growth factor in patients with Alzheimer disease. Neurology 2000, 54:2009-2011 - PubMed
- Hampel H, Buerger K, Kohnken R, Teipel SJ, Zinkowski R, Rappoport SI, Davies P: Tracking of Alzheimer disease progression with CSF tau protein phosphorylated at threonine 231. Ann Neurol 2001, 49:545-546 - PubMed
Publication types
MeSH terms
Substances
LinkOut - more resources
Full Text Sources
Other Literature Sources
Medical


