Odorant receptor expression defines functional units in the mouse olfactory system - PubMed (original) (raw)
Odorant receptor expression defines functional units in the mouse olfactory system
Thomas Bozza et al. J Neurosci. 2002.
Abstract
Odorant receptors (ORs) mediate the interaction of odorous compounds with olfactory sensory neurons (OSNs) and influence the guidance of OSN axons to synaptic targets in the olfactory bulb (OB). OSNs expressing the same OR send convergent axonal projections to defined glomeruli in the OB and are thought to share the same odorant response properties. This expectation of functional similarity has not been tested experimentally, because it has not been possible to determine reproducibly the response properties of OSNs that express defined ORs. Here, we applied calcium imaging to characterize the odorant response properties of single neurons from gene-targeted mice in which the green fluorescent protein is coexpressed with a particular OR. We show that the odorants acetophenone and benzaldehyde are agonists for the M71 OR and that M71-expressing neurons are functionally similar in their response properties across concentration. Replacing the M71 coding sequence with that of the rat I7 OR changes the stimulus response profiles of this genetically defined OSN population and concomitantly results in the formation of novel glomeruli in the OB. We further show that the mouse I7 OR imparts a particular response profile to OSNs regardless of the epithelial zone of expression. Our data provide evidence that ORs determine both odorant specificity and axonal convergence and thus direct functionally similar afferents to form particular glomeruli. They confirm and extend the notion that OR expression provides a molecular basis for the formation and arrangement of glomerular functional units.
Figures
Fig. 1.
Vital labeling of M71 and rI7→M71 OSNs. A, Wild-type M71 OR locus (1) showing the unmodified M71_coding sequence (light blue box) is shown with the_M71-IRES-tauGFP targeting vector (TV). Relevant restriction sites are indicated (R, Eco_RI). The M71 coding sequence is followed immediately after the stop codon by the_IRES (yellow box) and the_tauGFP_ coding sequence (green box), thus encoding a biscistronic message. The negative selectable marker HSV-tk followed by the positive selectable marker pgk-neo (gray box) are flanked by loxP sites (red triangles). The M71-G allele results from homologous recombination (2) and Cre-mediated excision of the selectable marker (3), leaving a single loxP site. The_black box_ on the right represents the 3′ external probe used to identify homologous recombination by Southern blot hybridization. Swap of the rat I7 coding sequence (orange box) into the M71 locus in which the M71 coding sequence is replaced with that of rat_I7_. Both IRES-GFP and_IRES-taulacZ_ are placed immediately downstream, thus encoding a tricistronic message. B, View of the medial turbinates in an epithelial whole mount from a homozygous M71-G mouse. tauGFP-labeled OSNs (bright green) are found in the dorsal, caudal epithelium (zone 4). Background autofluorescence reveals the overall structure of the turbinates. Inset, Fluorescence image of a single tauGFP-labeled M71 OSN taken after calcium recording. Note robust fluorescence in the cell body (bottom right), dendrite, and olfactory cilia (top left). C, Medial view of the turbinates in a homozygous rI7→M71-G mouse showing a similar pattern of GFP-labeled OSNs in the dorsalmost zone of the epithelium (zone 4). D, For comparison, all mature OSNs are labeled with GFP in an OMP-GFP mouse (Potter et al., 2001), revealing all epithelial zones. Autofluorescence in the respiratory epithelium is not visible because the exposure was adjusted for the intense GFP fluorescence from the sensory epithelium. A, Anterior; D, dorsal. Scale bar: B,C, D, 250 μm; inset in B, 12 μm.
Fig. 2.
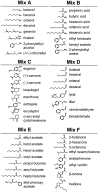
Chemical structures of odorant stimuli. The odorant stimulus set consists of 48 compounds divided into six mixtures (Mix A–Mix F) comprising several homologous series, including normal aliphatic and terpene alcohols, organic acids, aldehydes, esters, and ketones, as well as cyclic terpenoids and related compounds.
Fig. 3.
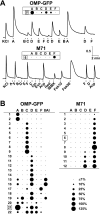
Similarity of response profiles to mixtures in M71 OSNs. A, Calcium imaging traces and corresponding dot plot response profiles from individual OSNs, OMP-GFP cell 21 (top), and M71-G cell 6 (bottom). Data are_F_340/_F_380ratios. Marks under the traces indicate 4 sec stimulus applications. All odorant concentrations were 25 μ
m
. KCl, High K+Ringer's solution; A–F, mixes A–F;Ion, β-ionone; Evn, ethyl vanillin;Acp, acetophenone; Hed, hedione;8Al, octanal; IBMX, 500 μ
m
IBMX; Fsk10, Fsk50, 10 and 50 μ
m
forskolin. The dot size represents the amplitude of the calcium response to an odorant at 25 μ
m
relative to the amplitude of the response to KCl. B, Plots for 22 individual OMP-GFP and 12 individual M71 OSNs tested with the odorant mixtures at 25 μ
m
. Whereas a wide variety of response profiles is seen in randomly selected OSNs, a restricted set of profiles is found in M71 OSNs. Scale on the bottom right shows the size of dots corresponding to selected response amplitudes.
Fig. 4.
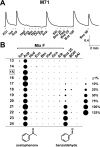
Identification of odorous agonists for M71.A, Calcium responses in an individual M71 OSN (cell 15) stimulated with individual mixture components. Odorant concentrations were 25 μ
m
unless otherwise noted.KCl, high K+ Ringer's solution;Ion, β-ionone; Acp, acetophenone;Hed, hedione; Evn, ethyl vanillin;Btn, butanone; Hxn, hexanone;Oct, octanone; Eik, ethyl isoamyl ketone;Bnz25, Bnz50, Bnz100, 25, 50, and 100 μ
m
benzaldehyde; BOH, benzyl alcohol; 8Al, octanal; IBMX, 500 μ
m
IBMX; Fsk10, 10 μ
m
forskolin. B, Response profiles for 12 individual M71 OSNs tested with mixture components at 25 μ
m
. Responses are observed to the mix F component acetophenone and to the mix D component benzaldehyde. Absence of a dot indicates that the stimulus was not tested. Chemical structures for M71 agonists are shown (bottom).
Fig. 5.
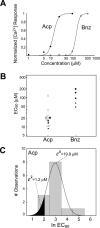
Dose–response relationships in M71 OSNs.A, Plot of calcium response versus odorant concentration for an M71 OSN to acetophenone (Acp; filled circles) and benzaldehyde (Bnz; open circles). Continuous lines represent best fits of the Hill equation to the normalized [Ca2+] response amplitudes. EC50 values for acetophenone and benzaldehyde for this cell are 14 and 150 μ
m,
respectively. B, Plot of EC50 values obtained from 13 individual M71 OSNs. Each _data point_represents the EC50 for a single neuron. Open circles represent cells in which only the EC50 for acetophenone was determined. Filled symbols represent five neurons in which EC50 values were determined for both acetophenone and benzaldehyde in the same cell. C, Gaussian fit to the distribution of acetophenone EC50values for M71 OSNs shown in B. The predicted mean EC50 for the most sensitive 10% of the neurons (black area) is 1.2 μ
m
, >10-fold lower than the mean EC50 for the population as a whole.
Fig. 6.
Odorant response profiles of rI7→M71 OSNs.A, Calcium responses in a single rI7→M71 OSN (cell 7) stimulated with the odorant mixtures and selected components at 25 μ
m
. B, Response profiles for 15 individual rI7→M71 OSNs tested with mixtures (left) and components (right) at 25 μ
m
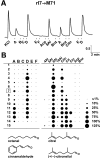
. Neurons responded to octanal, citronellal, citral, and cinnamaldehyde but not to acetophenone and benzaldehyde. Absence of a dot indicates that the odorant was not tested.KCl, High K+ Ringer's solution;A–F, mixes A–F; 4Al, butanal;6Al, hexanal; 8Al, octanal;10Al, decanal; Citn, (+)- and (−)-citronellal; Cit, citral; Cin, cinnamaldehyde; Acp, acetophenone; Bnz, benzaldehyde. Chemical structures for rI7→M71 agonists are shown (bottom).
Fig. 7.
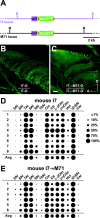
Response profiles of mouse I7 expressed in different zones. A, Top, Diagram of the (mI7-IRES-tauGFP) allele.IRES-tauGFP (green box) sequences are inserted just after the mouse I7 coding sequence (purple box) in the endogenous mouse_I7_ locus (purple line).Bottom, Diagram of the_mI7→M71-IRES-tauGFP_ allele. The mouse_I7_ coding sequence (purple box) and IRES-tauGFP sequences replace the M71 coding sequence in the M71 locus (black line). Both alleles are illustrated after Cre-mediated excision of the_neo_-selectable markers. B, View of the medial face of the turbinates in an I7-G mouse showing GFP-labeled neurons in the most ventral zone (zone 1) of the olfactory epithelium.C, View of the medial turbinates in an I7→M71-G mouse showing GFP-labeled neurons in the most dorsal zone of the olfactory epithelium (zone 4). Response profiles for eight mouse I7 neurons (D) and six mI7→M71 OSNs (E) tested with a homologous series of aldehydes at 25 μ
m
. Neurons from both strains exhibited similar response profiles. Large responses were elicited by heptanal, octanal, cinnamaldehyde, (+)-citronellal, (−)-citronellal, citral, and_trans_-2-octenal. Average responses (Avg) are shown at the bottom of each plot. 5Al, Pentanal; 6Al, hexanal; 7Al, heptanal; 8Al, octanal;9Al, nonanal; 10Al, decanal;Cin, cinnamaldehyde; Citn, citronellal;Cit, citral; Hct, hydroxycitronellal;t2–8Al, _trans_-2-octenal; Acp, acetophenone; Car, (+)- and (−)-carvone.
Fig. 8.
Shifted glomerular position in rI7→M71 mice.A, B, Dorsal view of the left and right OBs from a homozygous M71-G mouse (A) and from a homozygous rI7→M71-G mouse (B) showing the bilaterally symmetrical location of the lateral glomeruli in the dorsal OB. The horizontal arrow in B marks the midline of the mouse; right is above, and_left_ is below. Out-of-focus fluorescence from the medial glomeruli can also be seen in M71-G mice (A). Note the presence of a double lateral glomerulus in the left (bottom) OB in B. C, Medial view of the right OB from a M71-G × rI7→M71-G compound heterozygous mouse in which labeled rI7→M71 (left) and M71 (right) glomeruli form in the same mouse. The resulting glomeruli are smaller and less bright than those from homozygous M71-G and rI7→M71-G mice, consistent with the fact that approximately one-half of the number of axons converge to each glomerulus. The rat I7 swap shifts the site of axonal convergence anterior and ventral with respect to M71. D, Medial view of the right OB from a heterozygous OMP-GFP mouse in which all glomeruli are labeled. A, Anterior; L, lateral; D, dorsal; wt, wild type. Scale bar, 650 μm.
Fig. 9.
Formation of novel glomeruli by rI7→M71 OSNs.A, Cross-section through an M71 glomerulus in a heterozygous M71-G mouse. After staining with an antibody against Golf (red) to label all afferents, GFP-tagged (GFP+) axons are green and_red_ (yellow), and nontagged (GFP−) axons are only red. GFP+ and GFP− axons can be visualized in the same section when a glomerulus receives inputs from a mixed population of OSNs. B, The same experiment in homozygous M71-G mice shows that the M71 glomerulus receives most or all of its input from GFP+–Golf+(yellow) axons. C, The pattern of labeling in an rI7→M71 glomerulus in a homozygous rI7→M71-G mouse is indistinguishable from a homozygous M71 glomerulus and exhibits a preponderance of GFP+–Golf+(yellow) axons, indicating that these axons form novel glomeruli. All sections were counterstained with the nuclear dye TOTO-3 (blue). Scale bar, 25 μm.
Similar articles
- G-protein coupled receptors Mc4r and Drd1a can serve as surrogate odorant receptors in mouse olfactory sensory neurons.
Katidou M, Grosmaitre X, Lin J, Mombaerts P. Katidou M, et al. Mol Cell Neurosci. 2018 Apr;88:138-147. doi: 10.1016/j.mcn.2018.01.010. Epub 2018 Jan 31. Mol Cell Neurosci. 2018. PMID: 29407371 - Specificity of glomerular targeting by olfactory sensory axons.
Treloar HB, Feinstein P, Mombaerts P, Greer CA. Treloar HB, et al. J Neurosci. 2002 Apr 1;22(7):2469-77. doi: 10.1523/JNEUROSCI.22-07-02469.2002. J Neurosci. 2002. PMID: 11923411 Free PMC article. - Local permutations in the glomerular array of the mouse olfactory bulb.
Strotmann J, Conzelmann S, Beck A, Feinstein P, Breer H, Mombaerts P. Strotmann J, et al. J Neurosci. 2000 Sep 15;20(18):6927-38. doi: 10.1523/JNEUROSCI.20-18-06927.2000. J Neurosci. 2000. PMID: 10995837 Free PMC article. - Odorant receptor gene choice and axonal projection in the mouse olfactory system.
Imai T, Sakano H. Imai T, et al. Results Probl Cell Differ. 2009;47:57-75. doi: 10.1007/400_2008_3. Results Probl Cell Differ. 2009. PMID: 19083127 Review. - Roles of odorant receptors during olfactory glomerular map formation.
Nakashima A, Takeuchi H. Nakashima A, et al. Genesis. 2024 Jun;62(3):e23610. doi: 10.1002/dvg.23610. Genesis. 2024. PMID: 38874301 Review.
Cited by
- Insulin-Dependent Maturation of Newly Generated Olfactory Sensory Neurons after Injury.
Kuboki A, Kikuta S, Otori N, Kojima H, Matsumoto I, Reisert J, Yamasoba T. Kuboki A, et al. eNeuro. 2021 May 19;8(3):ENEURO.0168-21.2021. doi: 10.1523/ENEURO.0168-21.2021. Print 2021 May-Jun. eNeuro. 2021. PMID: 33906971 Free PMC article. - G protein-coupled odorant receptors underlie mechanosensitivity in mammalian olfactory sensory neurons.
Connelly T, Yu Y, Grosmaitre X, Wang J, Santarelli LC, Savigner A, Qiao X, Wang Z, Storm DR, Ma M. Connelly T, et al. Proc Natl Acad Sci U S A. 2015 Jan 13;112(2):590-5. doi: 10.1073/pnas.1418515112. Epub 2014 Dec 30. Proc Natl Acad Sci U S A. 2015. PMID: 25550517 Free PMC article. - Uncoupling stimulus specificity and glomerular position in the mouse olfactory system.
Zhang J, Huang G, Dewan A, Feinstein P, Bozza T. Zhang J, et al. Mol Cell Neurosci. 2012 Nov;51(3-4):79-88. doi: 10.1016/j.mcn.2012.08.006. Epub 2012 Aug 21. Mol Cell Neurosci. 2012. PMID: 22926192 Free PMC article. - Postnatal experience modulates functional properties of mouse olfactory sensory neurons.
He J, Tian H, Lee AC, Ma M. He J, et al. Eur J Neurosci. 2012 Aug;36(4):2452-60. doi: 10.1111/j.1460-9568.2012.08170.x. Epub 2012 Jun 15. Eur J Neurosci. 2012. PMID: 22703547 Free PMC article. - Ligand specificity of odorant receptors.
Khafizov K, Anselmi C, Menini A, Carloni P. Khafizov K, et al. J Mol Model. 2007 Mar;13(3):401-9. doi: 10.1007/s00894-006-0160-9. Epub 2006 Nov 21. J Mol Model. 2007. PMID: 17120078
References
- Araneda RC, Kini AD, Firestein S. The molecular receptive range of an odorant receptor. Nat Neurosci. 2000;3:1248–1255. - PubMed
- Belluscio L, Koentges G, Axel R, Dulac C. A map of pheromone receptor activation in the mammalian brain. Cell. 1999;97:209–220. - PubMed
- Brand A. GFP in Drosophila. Trends Genetics. 1995;11:324–325. - PubMed
Publication types
MeSH terms
Substances
LinkOut - more resources
Full Text Sources
Other Literature Sources
Molecular Biology Databases
Research Materials
Miscellaneous

