Does anticipation of pain affect cortical nociceptive systems? - PubMed (original) (raw)
Clinical Trial
Does anticipation of pain affect cortical nociceptive systems?
Carlo A Porro et al. J Neurosci. 2002.
Abstract
Anticipation of pain is a complex state that may influence the perception of subsequent noxious stimuli. We used functional magnetic resonance imaging (fMRI) to study changes of activity of cortical nociceptive networks in healthy volunteers while they expected the somatosensory stimulation of one foot, which might be painful (subcutaneous injection of ascorbic acid) or not. Subjects had no previous experience of the noxious stimulus. Mean fMRI signal intensity increased over baseline values during anticipation and during actual stimulation in the putative foot representation area of the contralateral primary somatosensory cortex (SI). Mean fMRI signals decreased during anticipation in other portions of the contralateral and ipsilateral SI, as well as in the anteroventral cingulate cortex. The activity of cortical clusters whose signal time courses showed positive or negative correlations with the individual psychophysical pain intensity curve was also significantly affected during the waiting period. Positively correlated clusters were found in the contralateral SI and bilaterally in the anterior cingulate, anterior insula, and medial prefrontal cortex. Negatively correlated clusters were found in the anteroventral cingulate bilaterally. In all of these areas, changes during anticipation were of the same sign as those observed during pain but less intense ( approximately 30-40% as large as peak changes during actual noxious stimulation). These results provide evidence for top-down mechanisms, triggered by anticipation, modulating cortical systems involved in sensory and affective components of pain even in the absence of actual noxious input and suggest that the activity of cortical nociceptive networks may be directly influenced by cognitive factors.
Figures
Fig. 1.
Experiment 1. Experimental design and mean + SEM heart rate profiles of the control and ascorbic acid groups during the experimental period. *p < 0.05 and **p < 0.01 indicate values from the two groups significantly different from baseline, respectively.
Fig. 2.
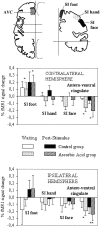
Experiment 1. Mean fMRI signal changes in selected ROIs. Top, Schematic drawings of the brain, showing the approximate location of ROIs in which significant mean fMRI signal changes occurred. The vertical and_horizontal lines_ on the left correspond to the interhemispheric fissure and to the vertical planes passing through the anterior and posterior commissure, respectively; those on the right correspond to the interhemispheric fissure and to the horizontal plane passing through the anterior and posterior commissures. AVC, Anteroventral cingulate. Mean Talairach coordinates (‖_x_‖, y,z, expressed in millimeters) of the centers of mass of ROIs were as follows: 6, 37, 10 for anteroventral cingulate; 9, −37, 60 for SI foot; 39, −26, 51 for SI hand; 51, −16, 37 for SI face. Data from the left and right hemispheres were pooled (see Materials and Methods), and therefore absolute (unsigned) values are given for the x coordinate. For the _y_coordinate, positive values are anterior, and negative values are posterior to the vertical plane passing through the anterior commissure. For the z coordinate, positive values are superior to the horizontal plane passing through the anterior and posterior commissures.Middle, Bottom, Mean normalized fMRI signal changes from baseline during the 45 sec preceding stimulus onset (waiting period) and during the first minute after stimulus in the control and ascorbic acid groups. *p < 0.05 and **p < 0.01 indicate data from the two groups significantly different from baseline (ANOVA plus difference contrast), respectively.
Fig. 3.
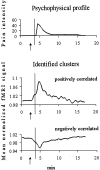
Signal changes in clusters encoding pain intensity over time in one representative subject. Time profiles of the perceived pain intensity (0–100 scale) (top) and of mean normalized fMRI signal intensities in cortical clusters whose signal time courses were positively (middle) or negatively (bottom) correlated with the individual psychophysical curve. Arrows point to the warning signal.Vertical lines indicate the time of the subcutaneous ascorbic acid injection. Note the changes from baseline activity before stimulation onset, which appear to be triggered by the warning signal.
Fig. 4.
Spatial distribution of clusters showing significant anticipation- and pain-related responses, in three representative subjects. Functional maps are superimposed on Talairach-transformed axial images at the levels of medial prefrontal cortex and anterior insula (z levels + 1 and + 10), anterior cingulate (z + 40), and foot area of the primary somatosensory cortex (z + 68), and on a paramedian sagittal image on the hemisphere contralateral to the injected foot (‖_x_‖= 8). They depict the location of cortical clusters encoding pain intensity, which also showed significant signal changes during the anticipatory phase.Yellow and blue indicate clusters positively or negatively correlated with the individual psychophysical curve, respectively. C, I, Contralateral and ipsilateral to the injection side (axial images), respectively.
Fig. 5.
Mean normalized fMRI signal changes from baseline in clusters showing positive or negative correlations with the individual psychophysical profile during the waiting period and the first 3 min after stimulation. *p < 0.05, **p < 0.01, and ***p < 0.001 indicate different from baseline. °p < 0.05 and °°p < 0.01 indicate different from the waiting period. All data from the poststimulus period were different from baseline at p < 0.001. AC, Anterior cingulate; INS, anterior insula; MPF, medial prefrontal cortex. Other abbreviations as in text and Figure2.
Fig. 6.
Experiment 2. Experimental design and mean heart rate data. Note the differences in the heart rate profiles between the control and cue conditions. **p < 0.01 indicates different from baseline; repeated-measures ANOVA plus simple contrast.
Fig. 7.
Experiment 2. Mean normalized fMRI signal changes from baseline during the waiting period in the cue condition and during the corresponding period in the control condition. °p < 0.05 indicates significant differences.
Similar articles
- Functional activity mapping of the mesial hemispheric wall during anticipation of pain.
Porro CA, Cettolo V, Francescato MP, Baraldi P. Porro CA, et al. Neuroimage. 2003 Aug;19(4):1738-47. doi: 10.1016/s1053-8119(03)00184-8. Neuroimage. 2003. PMID: 12948728 - Temporal and intensity coding of pain in human cortex.
Porro CA, Cettolo V, Francescato MP, Baraldi P. Porro CA, et al. J Neurophysiol. 1998 Dec;80(6):3312-20. doi: 10.1152/jn.1998.80.6.3312. J Neurophysiol. 1998. PMID: 9862924 Clinical Trial. - Uncertainty in anticipation of uncomfortable rectal distension is modulated by the autonomic nervous system--a fMRI study in healthy volunteers.
Rubio A, Van Oudenhove L, Pellissier S, Ly HG, Dupont P, Lafaye de Micheaux H, Tack J, Dantzer C, Delon-Martin C, Bonaz B. Rubio A, et al. Neuroimage. 2015 Feb 15;107:10-22. doi: 10.1016/j.neuroimage.2014.11.043. Epub 2014 Dec 3. Neuroimage. 2015. PMID: 25479021 - Percept-related activity in the human somatosensory system: functional magnetic resonance imaging studies.
Porro CA, Lui F, Facchin P, Maieron M, Baraldi P. Porro CA, et al. Magn Reson Imaging. 2004 Dec;22(10):1539-48. doi: 10.1016/j.mri.2004.10.003. Magn Reson Imaging. 2004. PMID: 15707803 Review. - Meta-analytic evidence for common and distinct neural networks associated with directly experienced pain and empathy for pain.
Lamm C, Decety J, Singer T. Lamm C, et al. Neuroimage. 2011 Feb 1;54(3):2492-502. doi: 10.1016/j.neuroimage.2010.10.014. Epub 2010 Oct 12. Neuroimage. 2011. PMID: 20946964 Review.
Cited by
- Striatal-limbic activation is associated with intensity of anticipatory anxiety.
Yang H, Spence JS, Devous MD Sr, Briggs RW, Goyal A, Xiao H, Yadav H, Adinoff B. Yang H, et al. Psychiatry Res. 2012 Nov 30;204(2-3):123-31. doi: 10.1016/j.pscychresns.2012.10.001. Epub 2012 Nov 6. Psychiatry Res. 2012. PMID: 23137803 Free PMC article. - Mouse models of surgical and neuropathic pain produce distinct functional alterations to prodynorphin expressing neurons in the prelimbic cortex.
Zhou S, Yin Y, Sheets PL. Zhou S, et al. Neurobiol Pain. 2023 Feb 13;13:100121. doi: 10.1016/j.ynpai.2023.100121. eCollection 2023 Jan-Jul. Neurobiol Pain. 2023. PMID: 36864928 Free PMC article. - Does it look painful or disgusting? Ask your parietal and cingulate cortex.
Benuzzi F, Lui F, Duzzi D, Nichelli PF, Porro CA. Benuzzi F, et al. J Neurosci. 2008 Jan 23;28(4):923-31. doi: 10.1523/JNEUROSCI.4012-07.2008. J Neurosci. 2008. PMID: 18216200 Free PMC article. - The blockade of the transient receptor potential vanilloid type 1 and fatty acid amide hydrolase decreases symptoms and central sequelae in the medial prefrontal cortex of neuropathic rats.
de Novellis V, Vita D, Gatta L, Luongo L, Bellini G, De Chiaro M, Marabese I, Siniscalco D, Boccella S, Piscitelli F, Di Marzo V, Palazzo E, Rossi F, Maione S. de Novellis V, et al. Mol Pain. 2011 Jan 17;7:7. doi: 10.1186/1744-8069-7-7. Mol Pain. 2011. PMID: 21241462 Free PMC article.
References
- Andersson LR, Lilja A, Hartvig P, Langstrom B, Gordh T, Handwerker H, Torebjork E. Somatotopic organization along the central sulcus, for pain localization in humans, as revealed by positron emission tomography. Exp Brain Res. 1997;117:192–199. - PubMed
- Augustine JR. Circuitry and functional aspects of the insular lobe in primates including humans. Brain Res Rev. 1996;22:229–244. - PubMed
- Bandettini PA, Jesmanowicz A, Wong EC, Hyde JS. Processing strategies for time-course data sets in functional MRI of the human brain. Magn Reson Med. 1993;30:161–173. - PubMed
- Baron F, Baron Y, Disbrow E, Roberts TPL. Brain processing of capsaicin-induced secondary hyperalgesia. Neurology. 1999;53:548–557. - PubMed
- Brefczynski J, DeYoe E. A physiological correlate of the “spotlight” of visual attention. Nat Neurosci. 1999;2:370–374. - PubMed
Publication types
MeSH terms
Substances
LinkOut - more resources
Full Text Sources
Medical


