Mammalian Ku86 mediates chromosomal fusions and apoptosis caused by critically short telomeres - PubMed (original) (raw)
Mammalian Ku86 mediates chromosomal fusions and apoptosis caused by critically short telomeres
Silvia Espejel et al. EMBO J. 2002.
Abstract
Here we analyze the functional interaction between Ku86 and telomerase at the mammalian telomere by studying mice deficient for both proteins. We show that absence of Ku86 prevents the end-to-end chromosomal fusions that result from critical telomere shortening in telomerase-deficient mice. In addition, Ku86 deficiency rescues the male early germ cell apoptosis triggered by short telomeres in these mice. Together, these findings define a role for Ku86 in mediating chromosomal instability and apoptosis triggered by short telomeres. In addition, we show here that Ku86 deficiency results in telomerase-dependent telomere elongation and in the fusion of random pairs of chromosomes in telomerase-proficient cells, suggesting a model in which Ku86 keeps normal-length telomeres less accessible to telomerase-mediated telomere lengthening and to DNA repair activities.
Figures
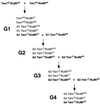
Fig. 1. Generation of the different mutant mice. The genotypes printed in gray are those used for the analysis.
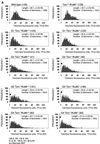
Fig. 2. (A) Telomere length distribution in primary MEFs. One TFU corresponds to 1 kb of TTAGGG repeats (Zijlmans et al., 1997). Arrows indicate telomeres with <1 kb of TTAGGG repeats. Average telomere length and the standard error, as well as the total number of telomeres analyzed, are indicated. Note that standard error and not standard deviation is shown. The distribution of the telomere length frequencies for each MEF is an indication of the standard deviation. Littermate MEFs are shown. (B) Quantification using Q-FISH of the percentage of telomeres with undetectable TTAGGG repeats out of the total number of telomeres shown in (A). Littermate MEFs are indicated. (C) Telomeric fluorescence (in arbitrary units, a.u.) using flow cytometry combined with telomeric Q-FISH (Flow-FISH). Littermate mice are indicated. (D) TRF analysis of primary BM cells or liver nuclei, as indicated, from different genotypes. Notice the upwards shift of TRF fragments in Terc+/+/Ku86–/– compared with the wild type. Littermate mice are indicated. (E) G-strand overhangs using liver nuclei visualized in the native gel after hybridization with a (CCCTAA)4 probe. Notice that upon treatment with mung bean nuclease (mbn), the G-strand-specific signal decreases. As control, the same gel was denatured and reprobed with the (CCCTAA)4 probe to visualize telomeres. Table I shows quantification of the G-strand overhang signals corrected by the denaturing gel hybridization signal for the 0 units of mbn lanes. Littermate mice are indicated.
Fig. 2. (A) Telomere length distribution in primary MEFs. One TFU corresponds to 1 kb of TTAGGG repeats (Zijlmans et al., 1997). Arrows indicate telomeres with <1 kb of TTAGGG repeats. Average telomere length and the standard error, as well as the total number of telomeres analyzed, are indicated. Note that standard error and not standard deviation is shown. The distribution of the telomere length frequencies for each MEF is an indication of the standard deviation. Littermate MEFs are shown. (B) Quantification using Q-FISH of the percentage of telomeres with undetectable TTAGGG repeats out of the total number of telomeres shown in (A). Littermate MEFs are indicated. (C) Telomeric fluorescence (in arbitrary units, a.u.) using flow cytometry combined with telomeric Q-FISH (Flow-FISH). Littermate mice are indicated. (D) TRF analysis of primary BM cells or liver nuclei, as indicated, from different genotypes. Notice the upwards shift of TRF fragments in Terc+/+/Ku86–/– compared with the wild type. Littermate mice are indicated. (E) G-strand overhangs using liver nuclei visualized in the native gel after hybridization with a (CCCTAA)4 probe. Notice that upon treatment with mung bean nuclease (mbn), the G-strand-specific signal decreases. As control, the same gel was denatured and reprobed with the (CCCTAA)4 probe to visualize telomeres. Table I shows quantification of the G-strand overhang signals corrected by the denaturing gel hybridization signal for the 0 units of mbn lanes. Littermate mice are indicated.
Fig. 2. (A) Telomere length distribution in primary MEFs. One TFU corresponds to 1 kb of TTAGGG repeats (Zijlmans et al., 1997). Arrows indicate telomeres with <1 kb of TTAGGG repeats. Average telomere length and the standard error, as well as the total number of telomeres analyzed, are indicated. Note that standard error and not standard deviation is shown. The distribution of the telomere length frequencies for each MEF is an indication of the standard deviation. Littermate MEFs are shown. (B) Quantification using Q-FISH of the percentage of telomeres with undetectable TTAGGG repeats out of the total number of telomeres shown in (A). Littermate MEFs are indicated. (C) Telomeric fluorescence (in arbitrary units, a.u.) using flow cytometry combined with telomeric Q-FISH (Flow-FISH). Littermate mice are indicated. (D) TRF analysis of primary BM cells or liver nuclei, as indicated, from different genotypes. Notice the upwards shift of TRF fragments in Terc+/+/Ku86–/– compared with the wild type. Littermate mice are indicated. (E) G-strand overhangs using liver nuclei visualized in the native gel after hybridization with a (CCCTAA)4 probe. Notice that upon treatment with mung bean nuclease (mbn), the G-strand-specific signal decreases. As control, the same gel was denatured and reprobed with the (CCCTAA)4 probe to visualize telomeres. Table I shows quantification of the G-strand overhang signals corrected by the denaturing gel hybridization signal for the 0 units of mbn lanes. Littermate mice are indicated.
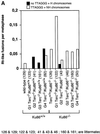
Fig. 3. (A) Frequencies of RT-like fusions per metaphase in primary MEFs from different genotypes. White bars, fusions showing TTAGGG signals at the fusion point and involving non-homologous pairs of chromosomes (NH). Black bars, fusions with undetectable TTAGGG signals at the fusion point and involving homologous pairs of chromosomes (H); these fusions are largely rescued in the absence of Ku86 in late-generation G3 and G4 telomerase-deficient mice. Littermate MEFs are indicated. (B) Top: complete SKY of a metaphase from a G4 Terc–/–/Ku86–/– primary MEF. The corresponding spectral image, the DAPI banding and the classified spectrum are shown for illustrative purposes. Arrowheads point to two RT-like fusions with involvement of non-homologous chromosomes and to one acentric fragment. Bottom: detail from a G4 Terc–/–/Ku86–/– metaphase showing chromosome breaks and gaps from a G4 Terc–/–/Ku86–/– primary MEF. (C) Representative examples of chromosomal aberrations detected by combined Q-FISH and SKY analyses on primary MEFs from the indicated genotypes. Notice that the fusions associated with Ku86 deficiency always show TTAGGG signals at the fusion point and involve random pairs of chromosomes, whereas a fraction of the fusions associated with critical telomere shortening are characterized by lacking TTAGGG signals at the fusion point and involving homologous pairs of chromosomes.
Fig. 3. (A) Frequencies of RT-like fusions per metaphase in primary MEFs from different genotypes. White bars, fusions showing TTAGGG signals at the fusion point and involving non-homologous pairs of chromosomes (NH). Black bars, fusions with undetectable TTAGGG signals at the fusion point and involving homologous pairs of chromosomes (H); these fusions are largely rescued in the absence of Ku86 in late-generation G3 and G4 telomerase-deficient mice. Littermate MEFs are indicated. (B) Top: complete SKY of a metaphase from a G4 Terc–/–/Ku86–/– primary MEF. The corresponding spectral image, the DAPI banding and the classified spectrum are shown for illustrative purposes. Arrowheads point to two RT-like fusions with involvement of non-homologous chromosomes and to one acentric fragment. Bottom: detail from a G4 Terc–/–/Ku86–/– metaphase showing chromosome breaks and gaps from a G4 Terc–/–/Ku86–/– primary MEF. (C) Representative examples of chromosomal aberrations detected by combined Q-FISH and SKY analyses on primary MEFs from the indicated genotypes. Notice that the fusions associated with Ku86 deficiency always show TTAGGG signals at the fusion point and involve random pairs of chromosomes, whereas a fraction of the fusions associated with critical telomere shortening are characterized by lacking TTAGGG signals at the fusion point and involving homologous pairs of chromosomes.
Fig. 3. (A) Frequencies of RT-like fusions per metaphase in primary MEFs from different genotypes. White bars, fusions showing TTAGGG signals at the fusion point and involving non-homologous pairs of chromosomes (NH). Black bars, fusions with undetectable TTAGGG signals at the fusion point and involving homologous pairs of chromosomes (H); these fusions are largely rescued in the absence of Ku86 in late-generation G3 and G4 telomerase-deficient mice. Littermate MEFs are indicated. (B) Top: complete SKY of a metaphase from a G4 Terc–/–/Ku86–/– primary MEF. The corresponding spectral image, the DAPI banding and the classified spectrum are shown for illustrative purposes. Arrowheads point to two RT-like fusions with involvement of non-homologous chromosomes and to one acentric fragment. Bottom: detail from a G4 Terc–/–/Ku86–/– metaphase showing chromosome breaks and gaps from a G4 Terc–/–/Ku86–/– primary MEF. (C) Representative examples of chromosomal aberrations detected by combined Q-FISH and SKY analyses on primary MEFs from the indicated genotypes. Notice that the fusions associated with Ku86 deficiency always show TTAGGG signals at the fusion point and involve random pairs of chromosomes, whereas a fraction of the fusions associated with critical telomere shortening are characterized by lacking TTAGGG signals at the fusion point and involving homologous pairs of chromosomes.
Fig. 4. (A) Quantification of TUNEL+ cells per 100 tubules of a total of 3–4 different mice of each of the indicated genotypes. (B) Apoptosis in DAPI-stained (blue) Ku86-deficient and Ku86-proficient Terc–/– testis cryosections with progressive telomere shortening. Fluorescein isothiocyanate- labeled TUNEL+ cells (in green) are detected at low frequency in testes from wild-type or G1 Terc–/– mice, irrespective of their Ku86 status. Increased TUNEL+ cells are seen in G3 Terc–/– testes with critically short telomeres. In contrast, the frequency of TUNEL+ cells in G3 Terc–/–/Ku86–/– testis is similar to that of wild-type testis. Magnification, ×20. Hematoxylin–eosin staining of G3 Terc–/– seminiferous tubules is also shown. Notice the paucity of germ cells and the presence of Sertoli-only tubules in a G3 Terc–/–/Ku86+/+ testis, while germ cell maturation is preserved in a G3 Terc–/–/Ku86–/– counterpart. Magnification, ×10.
Fig. 4. (A) Quantification of TUNEL+ cells per 100 tubules of a total of 3–4 different mice of each of the indicated genotypes. (B) Apoptosis in DAPI-stained (blue) Ku86-deficient and Ku86-proficient Terc–/– testis cryosections with progressive telomere shortening. Fluorescein isothiocyanate- labeled TUNEL+ cells (in green) are detected at low frequency in testes from wild-type or G1 Terc–/– mice, irrespective of their Ku86 status. Increased TUNEL+ cells are seen in G3 Terc–/– testes with critically short telomeres. In contrast, the frequency of TUNEL+ cells in G3 Terc–/–/Ku86–/– testis is similar to that of wild-type testis. Magnification, ×20. Hematoxylin–eosin staining of G3 Terc–/– seminiferous tubules is also shown. Notice the paucity of germ cells and the presence of Sertoli-only tubules in a G3 Terc–/–/Ku86+/+ testis, while germ cell maturation is preserved in a G3 Terc–/–/Ku86–/– counterpart. Magnification, ×10.
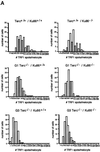
Fig. 5. (A) The histograms show the frequency distribution of the number of TRF1 spots per meiotic cell (n = 100 cells). (B) TRF1 distribution in pachytene meiocytes. The TRF1 signal (green) localizes at the end of paired meiotic chromosomes at the pachytene stage (red).
Fig. 5. (A) The histograms show the frequency distribution of the number of TRF1 spots per meiotic cell (n = 100 cells). (B) TRF1 distribution in pachytene meiocytes. The TRF1 signal (green) localizes at the end of paired meiotic chromosomes at the pachytene stage (red).
Similar articles
- Mammalian Ku86 protein prevents telomeric fusions independently of the length of TTAGGG repeats and the G-strand overhang.
Samper E, Goytisolo FA, Slijepcevic P, van Buul PP, Blasco MA. Samper E, et al. EMBO Rep. 2000 Sep;1(3):244-52. doi: 10.1093/embo-reports/kvd051. EMBO Rep. 2000. PMID: 11256607 Free PMC article. - Impact of telomerase ablation on organismal viability, aging, and tumorigenesis in mice lacking the DNA repair proteins PARP-1, Ku86, or DNA-PKcs.
Espejel S, Klatt P, Ménissier-de Murcia J, Martín-Caballero J, Flores JM, Taccioli G, de Murcia G, Blasco MA. Espejel S, et al. J Cell Biol. 2004 Nov 22;167(4):627-38. doi: 10.1083/jcb.200407178. Epub 2004 Nov 15. J Cell Biol. 2004. PMID: 15545322 Free PMC article. - Role of human Ku86 in telomere length maintenance and telomere capping.
Jaco I, Muñoz P, Blasco MA. Jaco I, et al. Cancer Res. 2004 Oct 15;64(20):7271-8. doi: 10.1158/0008-5472.CAN-04-1381. Cancer Res. 2004. PMID: 15492246 - DNA repair factors and telomere-chromosome integrity in mammalian cells.
Hande MP. Hande MP. Cytogenet Genome Res. 2004;104(1-4):116-22. doi: 10.1159/000077475. Cytogenet Genome Res. 2004. PMID: 15162024 Review. - Ku: a multifunctional protein involved in telomere maintenance.
Fisher TS, Zakian VA. Fisher TS, et al. DNA Repair (Amst). 2005 Nov 21;4(11):1215-26. doi: 10.1016/j.dnarep.2005.04.021. Epub 2005 Jun 24. DNA Repair (Amst). 2005. PMID: 15979949 Review.
Cited by
- The Role of RNA in DNA Breaks, Repair and Chromosomal Rearrangements.
Murashko MM, Stasevich EM, Schwartz AM, Kuprash DV, Uvarova AN, Demin DE. Murashko MM, et al. Biomolecules. 2021 Apr 9;11(4):550. doi: 10.3390/biom11040550. Biomolecules. 2021. PMID: 33918762 Free PMC article. Review. - Mechanisms of telomere loss and their consequences for chromosome instability.
Muraki K, Nyhan K, Han L, Murnane JP. Muraki K, et al. Front Oncol. 2012 Oct 4;2:135. doi: 10.3389/fonc.2012.00135. eCollection 2012. Front Oncol. 2012. PMID: 23061048 Free PMC article. - Ku80 facilitates chromatin binding of the telomere binding protein, TRF2.
Fink LS, Lerner CA, Torres PF, Sell C. Fink LS, et al. Cell Cycle. 2010 Sep 15;9(18):3798-806. doi: 10.4161/cc.9.18.13129. Epub 2010 Sep 25. Cell Cycle. 2010. PMID: 20890109 Free PMC article. - Telomere structure, function and maintenance in Arabidopsis.
Riha K, Shippen DE. Riha K, et al. Chromosome Res. 2003;11(3):263-75. doi: 10.1023/a:1022892010878. Chromosome Res. 2003. PMID: 12769293 Review. - Defending the end zone: studying the players involved in protecting chromosome ends.
Chan SS, Chang S. Chan SS, et al. FEBS Lett. 2010 Sep 10;584(17):3773-8. doi: 10.1016/j.febslet.2010.06.016. Epub 2010 Jun 19. FEBS Lett. 2010. PMID: 20579983 Free PMC article. Review.
References
- Bailey S.M., Conforth,M.N., Kurimasa,A., Chen,D.J. and Goodwin,E.H. (2001) Strand-specific postreplicative processing of mammalian telomeres. Science, 293, 2462–2465. - PubMed
- Baumann P. and Cech,T.R. (2001) Pot1, the putative telomere end-binding protein in fission yeast and humans. Science, 292, 1171–1175. - PubMed
- Bianchi A. and de Lange,T. (1999) Ku binds telomeric DNA in vitro. J. Biol. Chem., 274, 21223–21227. - PubMed
- Bilaud T., Brun,C., Ancelin,K., Koering,C.E., Laroche,T. and Gilson,E. (1997) Telomeric localization of TRF2, a novel human telobox protein. Nature Genet., 17, 236–239. - PubMed
Publication types
MeSH terms
Substances
LinkOut - more resources
Full Text Sources
Other Literature Sources
Molecular Biology Databases
Research Materials
Miscellaneous


