Efficient adenovirus-mediated gene transfer into primary T cells and thymocytes in a new coxsackie/adenovirus receptor transgenic model - PubMed (original) (raw)
Efficient adenovirus-mediated gene transfer into primary T cells and thymocytes in a new coxsackie/adenovirus receptor transgenic model
Vincent Hurez et al. BMC Immunol. 2002.
Abstract
Background: Gene transfer studies in primary T cells have suffered from the limitations of conventional viral transduction or transfection techniques. Replication-defective adenoviral vectors are an attractive alternative for gene delivery. However, naive lymphocytes are not readily susceptible to infection with adenoviruses due to insufficient expression of the coxsackie/adenovirus receptor.
Results: To render T cells susceptible to adenoviral gene transfer, we have developed three new murine transgenic lines in which expression of the human coxsackie/adenovirus receptor (hCAR) with a truncated cytoplasmic domain (hCAR(Delta)cyt) is limited to thymocytes and lymphocytes under direction of a human CD2 mini-gene. hCAR(Delta)cyt.CD2 transgenic mice were crossed with DO11.10 T cell receptor transgenic mice (DO11.hCAR(Delta)cyt) to allow developmental studies in a defined, clonal T cell population. Expression of hCAR(Delta)cyt enabled adenoviral transduction of resting primary CD4+ T cells, differentiated effector T cells and thymocytes from DO11.hCAR(Delta)cyt with high efficiency. Expression of hCAR(Delta)cyt transgene did not perturb T cell development in these mice and adenoviral transduction of DO11.hCAR(Delta)cyt T cells did not alter their activation status, functional responses or differentiative potential. Adoptive transfer of the transduced T cells into normal recipients did not modify their physiologic localization.
Conclusion: The DO11.hCAR(Delta)cyt transgenic model thus allows efficient gene transfer in primary T cell populations and will be valuable for novel studies of T cell activation and differentiation.
Figures
Figure 1
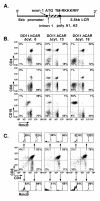
hCARΔcyt transgene map and expression in lymph node cells and thymocytes of hCAR transgenic mice. A. An 807 bp fragment (hatched box) encoding the extracellular and transmembrane region with a truncated cytoplasmic tail (TM-RKKKRR*) of the human CAR was cloned into the EcoRI/SmaI site of VA hCD2. The hCARΔcyt coding region was inserted between intron 1 of hCD2 and the poly A1 site from the hCD2 3' untranslated region. All potential ATG start codons in exon 1 of hCD2 have been mutated [16]. B. Lymphoid cells were isolated from three different transgenic lines (6, 13 and 18) and stained with RmcB anti-human CAR mAb and anti-mouse CD4, CD8 or CD19 before analysis on a FACSscan. The quadrants were set based on the staining of a hCARΔcyt negative littermate control (data not shown). The graphs represent two-color dot plots of lymph node cells gated on viable lymphoid gate; the percentage of cells in each quadrant is indicated. C. Two-color dot plots of thymocytes stained with anti-CD4 and anti-CD8 mAbs. The staining with the anti-hCAR RmcB mAb is represented as a histogram for each corresponding quadrant with the percentage of positive cells.
Figure 2
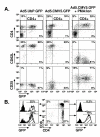
Transduction with Ad5.UbP.GFP and Ad5.CMV5.GFP of lymph node cells and thymocytes from line 18 mice. Lymph node cells and thymocytes from line 18 mice were isolated and transduced with Ad5.UbP.GFP or Ad5.CMV5.GFP adenoviral reporter vectors at a MOI of 10 for 30' and incubated for 24 h at 37°C/5%CO2. Half of the cells transduced with Ad5.CMV5.GFP were stimulated for 4 h with PMA/ionomycin before analysis. Lymph node cells were then stained with anti-CD4, anti-CD25 and anti-CD62L; thymocytes were stained with anti-CD4 and anti-CD8. The quadrants were set based on the transduction of hCARΔcyt negative littermate controls (data not shown). A. Two color dot-plots of lymph nodes cells transduced with Ad5.Ubp.GFP or Ad5.CMV5.GFP with or without activation with PMA/ionomycin. The top panel represent the expression of hCARΔcyt and CD4 detected in the viable lymphoid gate while the two bottom panel were gated on CD4 positive cells only (rectangular gate). The percentage of cells in each quadrant is indicated. B. Two-color dot plot of CD4 and CD8 expression of line 18 thymocytes transduced with Ad5.UbP.GFP. The histograms represent the GFP expression for each thymocyte subset defined by their CD4 and CD8 expression. The percentage of GFP positive cells is indicated.
Figure 3
Transduction with Ad5.UbP.GFP and Ad5.CMV5.GFP of Th1 and Th2 lines derived from line 18 mice. Th1 and Th2 lines were derived from line 18 DO11.hCARΔcyt double transgenic mice by antigenic stimulation in polarizing conditions for 3 weeks. One week after the last antigenic stimulation, the resting Th1 and Th2 lines were transduced for 30' with Ad5.UbP.GFP or Ad5.CMV5.GFP at a MOI of 4 and incubated for 24 h at 37°C/5%CO2. Half of the cells transduced with Ad5.CMV5.GFP were stimulated for 4 h with PMA/ionomycin before analysis. The histograms represent the GFP expression of the Th1 (left panels) and Th2 (right panels) lines transduced with the indicated adenovirus with or without stimulation with PMA/ionomycin. The percentage of positive cells and mean fluorescence intensity are indicated in Table 1.
Figure 4
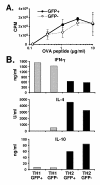
Transduction of CD4+ T cells from line 18 mice does not affect proliferation or cytokine production. CD4+ T cells were isolated from spleen and lymph nodes of line DO11.hCARΔcyt.18 double transgenic mice, transduced for 30' with Ad5.UbP.GFP at a MOI of 10 and incubated for 24 h at 37°C/5%CO2. The GFP positive and GFP negative population were then sorted on a FACSvantage cell sorter before assay. A. Proliferative responses of the GFP- and GFP+ population stimulated for 72 h with increasing amount of OVA peptide in the presence of irradiated BALB/c splenocytes. 50 μCi/ml [3H]thymidine was added to the cultures for 48 h before harvesting the cells and count of the incorporated radioactivity. The curves represent the dose-dependant proliferative responses (as indicated by the [3H]thymidine incorporation in CPM) of the GFP+ (closed circles) and the GFP- (open diamond) populations. B. Cytokine production of the transduced CD4+ cells. The GFP+ and GFP- sorted population were stimulated with irradiated BALB/c splenocytes and 5 μg/ml ovalbumin peptide in conditions driving them toward a Th1 or a Th2 phenotype. One week later, the culture supernatant were collected and analyzed by ELISA for the production of IFN-γ, IL-4 and IL-10. The histogram indicates the concentration of the different cytokines produced by the indicated populations. The relative concentrations were calculated using serial dilution of a known standard for each cytokine as a reference curve.
Figure 5
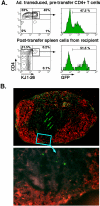
Adoptive transfer of CD4+ T cells from line 18 mice in BALB/c recipient. CD4+ T cells were isolated from spleen and lymph nodes of DO11.hCARΔcyt line 13 transgenic mice, transduced for 30' with Ad5.UbP.GFP at a MOI of 10 and incubated for 24 h at 37°C/5%CO2. 5 × 10⁶ transduced cells were injected in the tail vein of BALB/c mice. The mice were sacrificed after 48 h and the inguinal, axillary, submandibular and mesenteric lymph nodes, the spleen and the Peyer's Patches were isolated. A. Flow cytometric analysis of GFP expression of transduced CD4+ cells before and after adoptive transfer. Recovered, pooled lymph node cells from BALB/c recipients were stained with anti-CD4 and anti-DO11.10 TCR clonotypic mAb, KJ-126, and analyzed on a FACScan. The panels depict two-color dot plots of the transduced CD4+ cells before transfer (top panel) and the pooled lymph node cells from a representative BALB/c recipient (lower panel) and histograms representing the GFP expression for each of the CD4+KJ126+ population (square gate). The percentage of positive cells is indicated. B. Immunohistochemical analysis of a peripheral lymph node of Ad5.UbP.GFP-transduced CD4 T cell adoptive transfer recipient. An inguinal lymph node was processed and stained with anti-B22O (red) as described in Material and Methods. The red fluorescent areas define primary B cell follicles. GFP positive cells (green) are indicated (arrows) in parafollicular, T cell areas of a representative lymph node (magnification: top, 10×; bottom, 40×).
Similar articles
- Expression of a human coxsackie/adenovirus receptor transgene permits adenovirus infection of primary lymphocytes.
Schmidt MR, Piekos B, Cabatingan MS, Woodland RT. Schmidt MR, et al. J Immunol. 2000 Oct 1;165(7):4112-9. doi: 10.4049/jimmunol.165.7.4112. J Immunol. 2000. PMID: 11034423 - Significant increase of adenovirus infectivity in glioma cell lines by extracellular domain of hCAR.
Mori T, Arakawa H, Tokino T, Mineura K, Nakamura Y. Mori T, et al. Oncol Res. 1999;11(11-12):513-21. Oncol Res. 1999. PMID: 10905563 - Gene delivery into primary T cells: overview and characterization of a transgenic model for efficient adenoviral transduction.
Hurez V, Hautton RD, Oliver J, Matthews RJ, Weaver CK. Hurez V, et al. Immunol Res. 2002;26(1-3):131-41. doi: 10.1385/ir:26:1-3:131. Immunol Res. 2002. PMID: 12403352 Review. - Strategies for muscle-specific targeting of adenoviral gene transfer vectors.
Thirion C, Larochelle N, Volpers C, Dunant P, Stucka R, Holland P, Nalbantoglu J, Kochanek S, Lochmüller H. Thirion C, et al. Neuromuscul Disord. 2002 Oct;12 Suppl 1:S30-9. doi: 10.1016/s0960-8966(02)00079-2. Neuromuscul Disord. 2002. PMID: 12206792 Review.
Cited by
- A mouse model for HIV-1 entry.
Pietzsch J, Gruell H, Bournazos S, Donovan BM, Klein F, Diskin R, Seaman MS, Bjorkman PJ, Ravetch JV, Ploss A, Nussenzweig MC. Pietzsch J, et al. Proc Natl Acad Sci U S A. 2012 Sep 25;109(39):15859-64. doi: 10.1073/pnas.1213409109. Epub 2012 Sep 10. Proc Natl Acad Sci U S A. 2012. PMID: 23019371 Free PMC article. - Genetic modification of primary chronic lymphocytic leukemia cells with a lentivirus expressing CD38.
Pearce L, Morgan L, Lin TT, Hewamana S, Matthews RJ, Deaglio S, Rowntree C, Fegan C, Pepper C, Brennan P. Pearce L, et al. Haematologica. 2010 Mar;95(3):514-7. doi: 10.3324/haematol.2009.014381. Haematologica. 2010. PMID: 20207849 Free PMC article. - Simultaneous dystrophin and dysferlin deficiencies associated with high-level expression of the coxsackie and adenovirus receptor in transgenic mice.
Shaw CA, Larochelle N, Dudley RW, Lochmuller H, Danialou G, Petrof BJ, Karpati G, Holland PC, Nalbantoglu J. Shaw CA, et al. Am J Pathol. 2006 Dec;169(6):2148-60. doi: 10.2353/ajpath.2006.060570. Am J Pathol. 2006. PMID: 17148677 Free PMC article. - Control of alpha4beta7 integrin expression and CD4 T cell homing by the beta1 integrin subunit.
DeNucci CC, Pagán AJ, Mitchell JS, Shimizu Y. DeNucci CC, et al. J Immunol. 2010 Mar 1;184(5):2458-67. doi: 10.4049/jimmunol.0902407. Epub 2010 Jan 29. J Immunol. 2010. PMID: 20118278 Free PMC article. - Isoform-specific expression of the Coxsackie and adenovirus receptor (CAR) in neuromuscular junction and cardiac intercalated discs.
Shaw CA, Holland PC, Sinnreich M, Allen C, Sollerbrant K, Karpati G, Nalbantoglu J. Shaw CA, et al. BMC Cell Biol. 2004 Nov 8;5(1):42. doi: 10.1186/1471-2121-5-42. BMC Cell Biol. 2004. PMID: 15533241 Free PMC article.
References
- Costa GL, Benson JM, Seroogy CM, Achacoso P, Fathman CG, Nolan GP. Targeting rare populations of murine antigen-specific T lymphocytes by retroviral transduction for potential application in gene therapy for autoimmune disease. J Immunol. 2000;164:3581–90. - PubMed
- Berkner KL. Development of adenovirus vectors for the expression of heterologous genes. Biotechniques. 1988;6:616–29. - PubMed
- Haddada H, Cordier L, Perricaudet M. Gene therapy using adenovirus vectors. Curr Top Microbiol Immunol. 1995;199:297–306. - PubMed
Publication types
MeSH terms
Substances
Grants and funding
- R01 AI035783/AI/NIAID NIH HHS/United States
- AI 35783/AI/NIAID NIH HHS/United States
- DK44240/DK/NIDDK NIH HHS/United States
- R21 AI035783/AI/NIAID NIH HHS/United States
- WT_/Wellcome Trust/United Kingdom
- AR 43272/AR/NIAMS NIH HHS/United States
- P01 DK044240/DK/NIDDK NIH HHS/United States
LinkOut - more resources
Full Text Sources
Other Literature Sources
Research Materials


