Charting latency transcripts in Kaposi's sarcoma-associated herpesvirus by whole-genome real-time quantitative PCR - PubMed (original) (raw)
Charting latency transcripts in Kaposi's sarcoma-associated herpesvirus by whole-genome real-time quantitative PCR
Farnaz D Fakhari et al. J Virol. 2002 Jun.
Abstract
The division into a latent or lytic life cycle is fundamental to all herpesviridae. In the case of Kaposi's sarcoma-associated herpesvirus (KSHV) (human herpesvirus 8), latent genes have been implicated in cell autonomous transformation, while certain lytic genes procure a tumor friendly milieu through paracrine mechanism. To query KSHV transcription, we devised and validated a high-throughput, high-specificity, high-sensitivity, real-time quantitative reverse transcription-PCR array. This novel methodology is applicable to many human pathogens. Its first use demonstrated that the mRNA levels for KSHV LANA, v-cyclin, and v-FLIP do not increase at any time after viral reactivation. The mRNA for LANA-2/vIRF-3 is similarly resistant to viral reactivation. In contrast, every other latent or lytic message was induced. Hence, LANA, v-FLIP, v-cyclin, and LANA-2 constitute a group of uniquely regulated transcripts in the KSHV genome.
Figures
FIG. 1.
Ethidium bromide-stained 2% agarose gel of the PCR products for each KSHV ORF after 40 cycles. The template was reverse transcribed poly(A) mRNA from BCBL-1 cells 48 h after TPA induction. Most amplicons are of the same size; exceptions are noted by name.
FIG. 2.
Melting curve profile for selected KSHV ORFs after 40 cycles (amplification products for orf26, K9spl, LANA-2spl, actin, KbZIP, orf40spl, K9, LANA-2unspl, v-cyc, orf40unspl, orf57spl, orf57unspl). The template was reverse transcribed poly(A) mRNA from BCBL-1 cells 48 h after TPA induction. The temperature is shown on the horizontal axis. The vertical axis shows the value of the first derivative of the change in fluorescence intensity at each temperature. Thus, the peak identifies the phase transition.
FIG. 3.
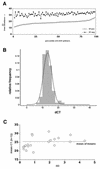
(A) CT values for each primer pair in the KSHV array. Closed circles indicate the CT values if poly(A) mRNA without RT was used (RTneg); open circles indicate the CT values if the mRNA was subjected to RT (RTpos). The vertical axis indicates the CT value, and the horizontal axis indicates the percentile of primers. (B) Frequency histogram of the dCT difference between RTpos and RTneg reactions for each primer pair. Superimposed is the expected normal distribution. The relative frequency is shown on the vertical, and the dCT is shown on the horizontal axis. (C) SD (on the horizontal scale) and mean (n = 3) CT values for a group of amplicons. The dotted line indicates the mean of means.
FIG. 4.
dCT values, which were normalized to CT
gapdh
for each primer pair in the KSHV array. The template was poly(A) mRNA from untreated BCBL-1 cells held in culture for 24, 48, and 72 h. The vertical axis indicates the dCT value, and the horizontal axis indicates the percentile of primers.
FIG. 5.
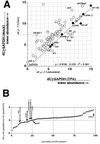
(A) Plot of the dCT values (normalized to gapdh) for each primer pair in the KSHV array (circles). The vertical axis indicates the dCT value from mock-treated BCBL-1 cells, and the horizontal axis indicates the dCT value from 48-h-TPA-treated BCBL-1 cells. Also shown is the regression line, equation, and _R_2 value through the values for latency type one mRNAs (solid dots). The dotted line traces the values for orfK8.1 under either condition. The “LANA” primer pairs are located either within the LANA ORF or within the LANA 5′UTR Similarly, for LANA-2/vIRF-3 we designed two primer pairs, one per exon. (B) Plot of the difference for each primer pair in the KSHV array between mock- and TPA-treated BCBL-1 cells at 48 h after induction. CT values were normalized to GAPDH to yield dCT, which were then compared to yield ddCT. The vertical axis indicates the ddCT value, the horizontal axis the percentile of the total distribution. Note that the ddCT values represent a log transformation of the relative abundance of the target mRNA. A value of ddCT = 0 indicates identical abundance of the target mRNA under each condition. A positive ddCT value indicates induction, and a negative ddCT value indicates suppression. Arrows indicate the values of latency type one genes.
FIG. 6.
Plot of dCT (normalized to GAPDH) for each primer pair in the KSHV array for TPA-treated BCBL-1 cells at 24, 48, and 72 h after induction as well as for mock-treated cells at 24 h. The vertical axis indicates the dCT value, and the horizontal axis indicates the percentile of the total distribution. Note that the ddCT values represent a log transformation of the relative abundance of the target mRNA. The arrows indicate primer pairs for which all three time points, as well as mock-treated cells, exhibit similar dCT values, i.e., the mRNA did not change upon TPA treatment. Primer pairs which measured mRNAs that did not respond to TPA in a consistent manner are indicated with asterisks.
FIG. 7.
Cluster analysis with dCT (normalized to GAPDH) values of each primer pair in the KSHV array for TPA-treated BCBL-1 cells at 24, 48, and 72 h after induction, as well for as mock-treated cells at 24 h. Data were median centered by gene and time point. Hence, mRNAs that are underrepresented are in shades of green, and those that are overrepresented are in red.
Similar articles
- Full-Length Isoforms of Kaposi's Sarcoma-Associated Herpesvirus Latency-Associated Nuclear Antigen Accumulate in the Cytoplasm of Cells Undergoing the Lytic Cycle of Replication.
Garrigues HJ, Howard K, Barcy S, Ikoma M, Moses AV, Deutsch GH, Wu D, Ueda K, Rose TM. Garrigues HJ, et al. J Virol. 2017 Nov 30;91(24):e01532-17. doi: 10.1128/JVI.01532-17. Print 2017 Dec 15. J Virol. 2017. PMID: 28978712 Free PMC article. - KSHV Genome Replication and Maintenance in Latency.
Ueda K. Ueda K. Adv Exp Med Biol. 2018;1045:299-320. doi: 10.1007/978-981-10-7230-7_14. Adv Exp Med Biol. 2018. PMID: 29896673 Review. - Pathological Features of Kaposi's Sarcoma-Associated Herpesvirus Infection.
Katano H. Katano H. Adv Exp Med Biol. 2018;1045:357-376. doi: 10.1007/978-981-10-7230-7_16. Adv Exp Med Biol. 2018. PMID: 29896675 Review.
Cited by
- Activation of the B cell antigen receptor triggers reactivation of latent Kaposi's sarcoma-associated herpesvirus in B cells.
Kati S, Tsao EH, Günther T, Weidner-Glunde M, Rothämel T, Grundhoff A, Kellam P, Schulz TF. Kati S, et al. J Virol. 2013 Jul;87(14):8004-16. doi: 10.1128/JVI.00506-13. Epub 2013 May 15. J Virol. 2013. PMID: 23678173 Free PMC article. - Kaposi's sarcoma-associated herpesvirus (KSHV) latency-associated nuclear antigen regulates the KSHV epigenome by association with the histone demethylase KDM3A.
Kim KY, Huerta SB, Izumiya C, Wang DH, Martinez A, Shevchenko B, Kung HJ, Campbell M, Izumiya Y. Kim KY, et al. J Virol. 2013 Jun;87(12):6782-93. doi: 10.1128/JVI.00011-13. Epub 2013 Apr 10. J Virol. 2013. PMID: 23576503 Free PMC article. - Conserved cysteine residues in Kaposi's sarcoma herpesvirus ORF34 are necessary for viral production and viral pre-initiation complex formation.
Watanabe T, McGraw A, Narayan K, Tibebe H, Kuriyama K, Nishimura M, Izumi T, Fujimuro M, Ohno S. Watanabe T, et al. J Virol. 2024 Aug 20;98(8):e0100024. doi: 10.1128/jvi.01000-24. Epub 2024 Jul 30. J Virol. 2024. PMID: 39078391 Free PMC article. - Promoter- and cell-specific transcriptional transactivation by the Kaposi's sarcoma-associated herpesvirus ORF57/Mta protein.
Palmeri D, Spadavecchia S, Carroll KD, Lukac DM. Palmeri D, et al. J Virol. 2007 Dec;81(24):13299-314. doi: 10.1128/JVI.00732-07. Epub 2007 Oct 3. J Virol. 2007. PMID: 17913801 Free PMC article. - A high-throughput method to monitor the expression of microRNA precursors.
Schmittgen TD, Jiang J, Liu Q, Yang L. Schmittgen TD, et al. Nucleic Acids Res. 2004 Feb 25;32(4):e43. doi: 10.1093/nar/gnh040. Nucleic Acids Res. 2004. PMID: 14985473 Free PMC article.
References
- Antman, K., and Y. Chang. 2000. Kaposi's sarcoma. N. Engl. J. Med. 342:1027-1038. - PubMed
- Ballestas, M. E., P. A. Chatis, and K. M. Kaye. 1999. Efficient persistence of extrachromosomal KSHV DNA mediated by latency-associated nuclear antigen. Science 284:641-644. - PubMed
- Biggar, R. J., D. Whitby, V. Marshall, A. C. Linhares, and F. Black. 2000. Human herpesvirus 8 in Brazilian Amerindians: a hyperendemic population with a new subtype. J. Infect. Dis. 181:1562-1568. - PubMed
- Boshoff, C., T. F. Schulz, M. M. Kennedy, A. K. Graham, C. Fisher, A. Thomas, J. O. McGee, R. A. Weiss, and J. J. O'Leary. 1995. Kaposi's sarcoma-associated herpesvirus infects endothelial and spindle cells. Nat. Med. 1:1274-1278. - PubMed
Publication types
MeSH terms
Substances
LinkOut - more resources
Full Text Sources


