Requirement for hippocampal CA3 NMDA receptors in associative memory recall - PubMed (original) (raw)
Fig. 1
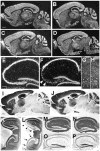
Distribution of Cre immunoreactivity and Cre/loxP recombination in G32-4 mice. (A) A parasagittal Vibratome section from the brain of a 4-week-old male G32-4 mouse was stained with a rabbit antibody against Cre, and Cre IR was visualized with fluorescein isothiocyanate. Arrowheads, CA3 pyramidal cell layer. Scale bar, 50 μm. (B to D) Coronal sections from the brain of an 8-week-old male G32-4/Rosa26 double-transgenic mouse stained with X-gal and Nuclear Fast Red. In forebrain (B and C), arrow, CA3 cell layer; arrowhead, dentate granule cell layer. In hindbrain (D), arrowheads, facial nerve nuclei. Scale bar, 100 μm. (E and F) Parasagittal hippocampal sections from the brain of an 8-week-old G32-4/Rosa26 double-transgenic mouse subjected to double immunofluorescence staining with (E) antibodies against β-galactosidase (visualized by Alexa488) and GAD67 (visualized by Cy3), or (F) with antibodies against β-galactosidase and calretinin (visualized by Cy3). Green, β-galactosidase IR; red in (E) GAD67-IR; red in (F), calretinin-IR. DG, dentate gyrus; Th, thalamus; white arrows, somata of mossy cells; white arrowheads, axon terminals of mossy cells. Scale bar, 10 μm.
Fig. 2
Distributions of NR1 mRNA, NR1 protein, and other proteins in brains of CA3-NR1 KO mice. (A to H) Dark field images of in situ hybridization on parasagittal brain sections with a 33P-labeled NR1 cRNA probe. The sources of the brains were (A) a 5-week-old male fNR1 control; (B) a 5-week-old male mutant [a littermate of the mouse in (A)]; (C, E, and G) an 18-week-old male fNR1 control; (D, F, and H) an 18-week-old male mutant [a littermate of the mouse in (C), (E), and (G)]. Scale bar, 100 μm. (E and F) The hippocampal regions of (C) and (D), respectively, are enlarged. (G and H) The areas of the facial nerve nuclei are enlarged. In the CA3 pyramidal cell layer of the mutant, the level of NR1 mRNA was normal until 5 weeks of age, started to decline thereafter, and reached the lowest and stable level by 18 weeks of age [arrowheads in (D)]. There was no indication of a reduced NR1 mRNA level in the mutant mice relative to the control littermates in any other brain area throughout the postnatal development. In particular, the levels of NR1 mRNA in the mutants’ dentate gyrus (F), cerebellum (B and D), and the facial nerve nuclei (H) are indistinguishable from those of the control littermates (A, C, E, and G). (F) Arrowheads indicate scattered hybridization signals that are likely derived from CA3 interneurons. (G and H) Arrowheads, the facial nerve nuclei. In (E) to (H), scale bar, 25 μm. (I to N) Immunoperoxidase staining of paraffin sections of brains derived from 18-week-old male mice visualized with 3,3′-diaminobenzidine. The primary antibodies used are specific for NR1 (I to L) and for GluR1 (M and N). The genotypes of the mice are fNR1 (control) (I, K, M), and CA3-NR1 KO (mutant) (J, L, N). Medial parasagittal sections were used for experiments other than those in (K) and (L), for which lateral parasagittal sections were used. In the mutants, NR1-IR was selectively deficient in the dorsal [arrowheads in (J) and (L)], as well as ventral [arrows in (L)] area CA3. Scale bar in (I), 100 μm. (K to P) See scale bar in (K), 50 μm. (O and P) Nissl staining of hippocampal sections derived from an 18-week-old male fNR1 mouse (O) and a male CA3-NR1 KO littermate (P). The mutant exhibited no gross morphological alteration.
Fig. 3
NMDAR function is absent only in the C/A-CA3 pathway of CA3-NR1 KO mice. (A) Synaptic responses were evoked and NMDA currents pharmacologically isolated. Details in the Materials and Methods section (17). (Left) Representative data from a control (fNR1) dentate gyrus granule cell (DG) showing a medial perforant path evoked NMDA current (isolated with DNQX and blocked by APV ). (Middle) C/A-evoked NMDA current. (Right) In a CA1 pyramidal cell, SC stimulation-elicited NR-mediated excitatory postsynaptic current. (B) Summary data for NMDA currents in fNR1 and mutant animals (***P < 0.0001).
Fig. 4
NMDA-dependent LTP at the recurrent CA3 synapses in CA3-NR1 KO mice. (A) Representative waveforms (averages of five consecutive responses recorded at 0.05 Hz) show that C/A-CA3 LTP was selectively prevented in mutant animals. (B) Summary graphs showing the time course of potentiation after three long trains of stimulation (100 pulses at 100 Hz concomitant with a 1-s depolarizing pulse 1 train every 20 s). (C) Cumulative probability plots; each point represents the magnitude of change relative to baseline (abscissa) as a cumulative fraction of the total number of experiments (ordinate) for a given experiment 20 to 25 min (average) after high-frequency stimulation. EPSP, excitatory postsynaptic potential.
Fig. 5
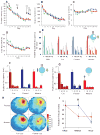
Performance of CA3-NR1 KO mice in the standard Morris water maze task and recall capability under various cue conditions. (A to D) 18- to 24-week-old male CA3-NR1 KO mice (mutant, red, n = 44), fNR1 (blue, n = 37), Cre (n = 14, not shown), and their wild-type littermates (green, n = 11) were subjected to training trials under full-cue conditions. The four types of mice did not differ significantly in (A) escape latency, (B) distance traveled, (C) swimming velocity, or (D) time spent near the pool wall [genotype effect for each measure, F(3,102) < 2.5, _P_ > 0.05; genotype x trial interaction for each measure, P > 0.05]. (E) Probe trials on day 2 (P1, open bars), day 7 (P2, hatched bars), and day 13 (P3, solid bars) under full-cue conditions, monitored by relative radial-quadrant occupancy [time (%) the mice spent in the target radial-quadrant relative to the total time spent in the four radial-quadrants]. On day 13, all the genotypes spent significantly more time in the target radial-quadrant than other quadrants [wild, F(3,40) = 84.1, P < 0.0001; Cre, _F_(3,52) = 52.7, _P_ < 0.0001; _fNR1_, _F_(3,144) = 130.4, _P_ < 0.0001; mutant, _F_(3,172) = 163.4, _P_ < 0.0001; Newman-Keuls post hoc comparison (the trained quadrant compared to all the other quadrants); _P_ < 0.01 for all genotypes]. (**F**) Day 13 probe trial (_P3_) of randomly selected subsets of Cre (_n_ = 14), _fNR1_ (_n_ = 20) and mutant (_n_ = 23) mice by absolute platform occupancy [time (sec) the mice spent in the area which corresponded exactly to the area occupied by the platform during the training session] [Cre, _F_(3,52) = 15.8, _P_ < 0.0001; _fNR1_, _F_(3,76) = 37.4, _P_ < 0.0001; mutant, _F_(3,88) = 35.5, _P_ < 0.0001; Newman-Keuls post hoc comparison (the target platform position compared to all the other platform positions); _P_ < 0.01 for all genotypes]. (**G**) The same sets of mice as in (F) were subjected to partial-cue probe trials on day 14 (_P4_) and absolute platform occupancy assessed. Cre and fNR1 mice exhibited similar recall under partial-cue conditions as under full-cue conditions (paired _t_ test, _P_ > 0.9 for each genotype), while recall by the mutant mice was impaired (paired t test, *P < 0.01). (H) Spatial histograms of the animals’ location during the full-cue (P3) and partial-cue (P4) probe trials. fNR1, n = 20; mutant, n = 23. (I) Relative recall index [RRI, averaged ratio of the target platform occupancy of the partial-cue (P4) or no-cue (P5) probe trial to that of the full-cue (P3) probe trial for each animal (17)] of fNR1 mice (n = 18, blue) and mutant mice (n = 22, red). The RRI value difference between the fNR1 and the mutant mice under the partial-cue conditions was significant (*P < 0.009; Mann-Whitney U test), while that under no-cue conditions was not (P = 0.9; Mann-Whitney U test). T, target quadrant; AR, adjacent right quadrant; OP, opposite quadrant; AL, adjacent left quadrant.
Fig. 6
CA1 place cell activity in CA3-NR1 KO mice. (A and B) Examples of place fields that are representative of cells that showed no reduction [fNR1 (A)] and a reduction of field size [mutant (B)] before and after partial cue removal. (C to E) Relative change in the place field properties for each cell recorded across two conditions quantified with a relative change index (RCI, defined as the difference between the cell’s firing between two conditions divided by the sum of the cell’s firing across the two conditions) (17). Among the cells that were identified as the same cells throughout the two recording sessions, the average burst spike frequency [(C): F(3,140) = 4.16, P < 0.007; Fisher’s post hoc comparison (mutant 4:1 vs. all the other three paradigms), *P < 0.05], place field size over 1 Hz [(D): F(3,140) = 2.68, P < 0.049; Fisher’s post hoc comparison (mutant 4:1 versus all the other three paradigms), *P < 0.05], and the integrated firing rate [(E): F(3,140) = 3.20, P < 0.025; Fisher’s post hoc comparison (mutant 4:1 versus all the other three paradigms), *P < 0.05], were significantly reduced in the mutant animals (red bars) only after partial cue removal (4:1). In contrast, partial cue removal did not affect CA1 place cell activity in the control mice (blue bars). (F) Location of CA1 place field center between the two recording sessions was not shifted regardless of genotype and cue manipulation (F): F(3,140) = 2.15, P = 0.097. F, fNR1 control mice; M, mutant mice.
Fig. 7
Model for a distinct role of areas CA3 and CA1 in memory storage and recall. (A) General organization of the hippocampus. Red arrows, pathways that form NR-dependent modifiable synapses in CA3; EC, entorhinal cortex; DG, dentate gyrus; RC, recurrent collaterals; SC, Schäffer collaterals; MF, mossy fibers; PP, perforant path. (B to E) Basic wiring of CA3 and CA1, illustrating the proposed mechanisms for pattern completion. In control (B) and mutant (D), full cue input (downward arrows) is provided to CA3 from DG or EC and to CA1 from EC. Although the nature of these inputs is likely to be different, we do not consider this difference in this model. In control (C) and mutant (E), a fraction of the original input is provided to activate the memory trace during recall. For detailed explanation, see Discussion. Red dots, CA3 RC synapses or SC-CA1 synapses participating in memory trace formation; red circles, memory traces that are activated during recall; red dots without red circles, memory trace not activated during recall; red triangles and lines, CA3 pyramidal cell activity resulting from pattern completion through recurrent collateral firing; green triangles and lines, CA3 pyramidal cell response to external cue information; open triangles and black lines, silent CA3 pyramidal cells and inactive outputs; blue triangles, CA1 pyramidal cells.


