Restricted islet-cell reactive T cell repertoire of early pancreatic islet infiltrates in NOD mice - PubMed (original) (raw)
Restricted islet-cell reactive T cell repertoire of early pancreatic islet infiltrates in NOD mice
Felix J Baker et al. Proc Natl Acad Sci U S A. 2002.
Abstract
The mechanisms responsible for initiating autoimmune diabetes remain obscure. Here, we describe a method for identifying both the alpha- and beta-chains of the T cell receptor (TCR) from individual pancreatic islet-infiltrating T cells at the earliest stages of disease in nonobese diabetic mice (NOD). Analysis of the TCR repertoire of these early islet infiltrates reveals enrichment for a small subset of TCR sequences. Reconstitution of these TCR in vitro demonstrates that these receptors confer reactivity to islet cells but not to the well characterized autoantigens, glutamic acid decarboxylase (GAD65) and insulin. Thus, autoimmune diabetes in NOD may be initiated by a limited number of antigens distinct from GAD65 and insulin.
Figures
Figure 1
Single-cell PCR method for TCR amplification. (A) Nested PCR strategy for specific amplification of TCR α- and β-chains from single cells. The thin lines connecting V(D)J segments represent areas of N-region addition. Regions are not drawn to scale. The upper set of arrows indicates the relative position of external oligonucleotides used in the first round of PCR. The lower set of arrows represents the nested position of the internal oligonucleotides used in the second round of PCR. (B) Sample PCR amplification of TCR α- and β-chains from 12 single CD4+ T cells using internal and external oligonucleotide pools. Completed second-round reactions were electrophoresed through a 1.5% agarose gel and stained with ethidium bromide. MW, molecular weight markers (100-bp ladder).
Figure 2
CDR3 sequences for Vβ8.2 TCR from early islet infiltrates in NOD. Amino acid sequence is presented with junctionally encoded sequences indicated in bold face. Vβ, Jβ usage, and CDR3 length are given in the three columns at the left of the figure. The presence of an aspartate or glutamate at position 2 of the CDR3 is highlighted.
Figure 3
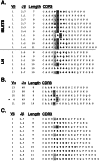
Vβ1 motif in early islet infiltrates in NOD. (A) CDR3 sequences for Vβ1 TCR from early islet infiltrates (Islets). Sequences from T cells in pancreas-draining lymph nodes (LN) from the same animals are included (Lower) for comparison. The presence of glutamine in position 2 of the CDR3 is indicated in light gray. Aspartate or glutamate at position 2 or 3 of the CDR3 is highlighted in dark gray. (B) Paired α-chain CDR3 sequences for 5 Vβ1 sequences. The presence of a junctionally encoded arginine at position 1 or 2 of the CDR3 is highlighted. (C) Vβ1 sequences from the islet infiltrates of 11-week-old NOD. (A_–_C) Amino acid sequence is presented with junctionally encoded sequences indicated in bold face. Vβ usage, Jβ usage, and CDR3 length are given in the three columns at the left of each panel. (A and_B_) *, denotes the sequence used for reconstitution experiments in Fig. 6.
Figure 4
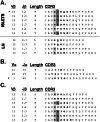
Vβ12 motif in early islet infiltrates in NOD. (A) CDR3 sequences for Vβ12 TCR from early islet infiltrates (Islets). Sequences from T cells in pancreas-draining lymph nodes (LN) from the same animals are included (Lower) for comparison. The presence of serine in position 1 of the CDR3 is indicated in light gray. Leucine at position 2 of the CDR3 is highlighted in dark gray. (B) Paired α-chain CDR3 sequences for 3 Vβ12 sequences. (C) Vβ12 sequences from the islet infiltrates of 11-week-old NOD. (A_–_C) Amino acid sequence is presented with junctionally encoded sequences indicated in bold face. Vβ usage, Jβ usage, and CDR3 length are given in the three columns at the left of each panel. (_A_and B) *, denotes the sequence used for reconstitution experiments in Fig. 6.
Figure 5
TCR β-chain variable region usage in (A) islet-infiltrating CD4+ T cells from 14- to 18-day-old NOD mice and in (B) peripheral CD4+ T cells from the same animals. (A) Full-length sequences (74) which could be clearly classified were obtained by the single-cell PCR protocol described in this report. (B) The relative frequency of β-chain variable regions was established by FACS staining. ND, not determined because antibodies are not currently available.
Figure 6
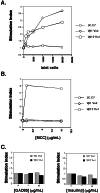
In vitro reconstitution of Vβ1Vα4 and Vβ12Vα1. (A) Reactivity to islet cells presented by I-Ag7 splenocytes. (B) Reactivity to MCC (88–103) peptide presented by I-Ek splenocytes. (C) Reactivity to GAD65 and insulin β-chain presented by I-Ag7 splenocytes. The GAD65 protein used in_C_ stimulates T cell hybridomas specific for GAD65 in the context of I-Ag7 in parallel experiments (M.L. and M.M.D., unpublished data). The recombinant insulin used in C is a commercially available reagent (Sigma). (A_–_C) Stimulation index corresponds to T cell proliferation in the presence of APC and the indicated amount of antigen normalized to the degree of proliferation observed in the presence of APC alone. The experiments for_A_–C were conducted in parallel by using the same APC and T cells. Data shown is the average value for at least two samples, with data values generally varying by less than 20%.
Similar articles
- Islet-associated T-cell receptor-β CDR sequence repertoire in prediabetic NOD mice reveals antigen-driven T-cell expansion and shared usage of VβJβ TCR chains.
Toivonen R, Arstila TP, Hänninen A. Toivonen R, et al. Mol Immunol. 2015 Mar;64(1):127-35. doi: 10.1016/j.molimm.2014.11.009. Epub 2014 Dec 3. Mol Immunol. 2015. PMID: 25480393 - Peri-islet infiltrates of young non-obese diabetic mice display restricted TCR beta-chain diversity.
Galley KA, Danska JS. Galley KA, et al. J Immunol. 1995 Mar 15;154(6):2969-82. J Immunol. 1995. PMID: 7533189 - T cells to a dominant epitope of GAD65 express a public CDR3 motif.
Quinn A, McInerney M, Huffman D, McInerney B, Mayo S, Haskins K, Sercarz E. Quinn A, et al. Int Immunol. 2006 Jun;18(6):967-79. doi: 10.1093/intimm/dxl033. Epub 2006 Apr 26. Int Immunol. 2006. PMID: 16641112 - Interactions of effectors and regulators are decisive in the manifestations of type 1 diabetes in nonobese diabetic mice.
Quinn A, Kumar V, Jensen KP, Sercarz EE. Quinn A, et al. Curr Dir Autoimmun. 2001;4:171-92. doi: 10.1159/000060537. Curr Dir Autoimmun. 2001. PMID: 11569402 Review. No abstract available. - T-cell responses to autoantigens in IDDM. The search for the Holy Grail.
Roep BO. Roep BO. Diabetes. 1996 Sep;45(9):1147-56. doi: 10.2337/diab.45.9.1147. Diabetes. 1996. PMID: 8772714 Review.
Cited by
- Paired analysis of TCRα and TCRβ chains at the single-cell level in mice.
Dash P, McClaren JL, Oguin TH 3rd, Rothwell W, Todd B, Morris MY, Becksfort J, Reynolds C, Brown SA, Doherty PC, Thomas PG. Dash P, et al. J Clin Invest. 2011 Jan;121(1):288-95. doi: 10.1172/JCI44752. Epub 2010 Dec 6. J Clin Invest. 2011. PMID: 21135507 Free PMC article. - The diabetogenic mouse MHC class II molecule I-Ag7 is endowed with a switch that modulates TCR affinity.
Yoshida K, Corper AL, Herro R, Jabri B, Wilson IA, Teyton L. Yoshida K, et al. J Clin Invest. 2010 May;120(5):1578-90. doi: 10.1172/JCI41502. Epub 2010 Apr 19. J Clin Invest. 2010. PMID: 20407212 Free PMC article. - Toxin-coupled MHC class I tetramers can specifically ablate autoreactive CD8+ T cells and delay diabetes in nonobese diabetic mice.
Vincent BG, Young EF, Buntzman AS, Stevens R, Kepler TB, Tisch RM, Frelinger JA, Hess PR. Vincent BG, et al. J Immunol. 2010 Apr 15;184(8):4196-204. doi: 10.4049/jimmunol.0903931. Epub 2010 Mar 10. J Immunol. 2010. PMID: 20220085 Free PMC article. - Celiac disease and transglutaminase 2: a model for posttranslational modification of antigens and HLA association in the pathogenesis of autoimmune disorders.
Sollid LM, Jabri B. Sollid LM, et al. Curr Opin Immunol. 2011 Dec;23(6):732-8. doi: 10.1016/j.coi.2011.08.006. Epub 2011 Sep 12. Curr Opin Immunol. 2011. PMID: 21917438 Free PMC article. Review. - Lifelong CMV infection improves immune defense in old mice by broadening the mobilized TCR repertoire against third-party infection.
Smithey MJ, Venturi V, Davenport MP, Buntzman AS, Vincent BG, Frelinger JA, Nikolich-Žugich J. Smithey MJ, et al. Proc Natl Acad Sci U S A. 2018 Jul 17;115(29):E6817-E6825. doi: 10.1073/pnas.1719451115. Epub 2018 Jul 2. Proc Natl Acad Sci U S A. 2018. PMID: 29967140 Free PMC article.
References
- Diabetes Control and Complications Trial Research Group. J Am Med Assoc. 1996;276:1409–1415. - PubMed
- McDevitt H O. Hosp Pract. 1995;30:55–62. - PubMed
- Slattery R M, Miller J F. Curr Top Microbiol Immunol. 1996;206:51–66. - PubMed
- Delovitch T L, Singh B. Immunity. 1997;7:727–738. - PubMed
- Prochazka M, Leiter E H, Serreze D V, Coleman D L. Science. 1987;237:286–289. - PubMed
Publication types
MeSH terms
Substances
LinkOut - more resources
Full Text Sources
Other Literature Sources
Medical


