How to describe protein motion without amino acid sequence and atomic coordinates - PubMed (original) (raw)
How to describe protein motion without amino acid sequence and atomic coordinates
Dengming Ming et al. Proc Natl Acad Sci U S A. 2002.
Abstract
This paper reports a computational method, the quantized elastic deformational model, that can reliably describe the conformational flexibility of a protein in the absence of the amino acid sequence and atomic coordinates. The essence of this method lies in the fact that, in modeling the functionally important conformational changes such as domain movements, it is possible to abandon the traditional concepts of protein structure (bonds, angles, dihedrals, etc.) and treat the protein as an elastic object. The shape and mass distribution of the object are described by the electron density maps, at various resolutions, from methods such as x-ray diffraction or cryo-electron microscopy. The amplitudes and directionality of the elastic deformational modes of a protein, whose patterns match the biologically relevant conformational changes, can then be derived solely based on the electron density map. The method yields an accurate description of protein dynamics over a wide range of resolutions even as low as 15-20 A at which there is nearly no visually distinguishable internal structures. Therefore, this method dramatically enhances the capability of studying protein motions in structural biology. It is also expected to have ample applications in related fields such as bioinformatics, structural genomics, and proteomics, in which one's ability to extract functional information from the not-so-well-defined structural models is vitally important.
Figures
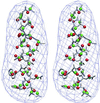
Figure 1
Schematic illustration of the A subunit of 2CCY (a) and 1AQB (b). The figures were made by graphic software Molscript (31) and rendered by RASTER3D (32).
Figure 2
Comparison of computed and experimental B-factor curves for 2CCY (a and c) for 1AQB (b and d). In a and b, GNM uses the Cα positions, and QEDM uses a 5-Å electron-density map. In c and d, QEDM is applied to electron-density maps of 5 Å, 7 Å, and 15 Å resolution. B-factors on the centroids of Voronoi cells computed at low resolutions by QEDM were mapped onto the Cα atoms based on a distance averaging method—i.e., the average B-factors on the centroids within 1.9 Å (half of the nearest Cα–Cα distance along the polypeptide chain) from a particular Cα atom is assigned to that Cα atom. Every B-factor curve is normalized against the experimental curve by matching the areas underneath the two curves. The cutoff distance was 6.8 Å.
Figure 3
The electron-density maps of 2CCY at 5 Å, 7 Å, and 15 Å resolution. The maps were generated by the Gaussian kernel convolution method (27). At 15 Å resolution, there is essentially no visually distinguishable internal structural features other than the overall shape of the molecule.
Figure 4
Stereo pair for the relative layout between the density map (shown in 15 Å resolution), protein structure (silver), centroids of Voronoi cells at 5 Å resolution (green), and 15 Å resolution (red). For clarity, only the results of one helix on 2CCY are shown. It is evident that the positions of the Voronoi centroids vary with different resolutions.
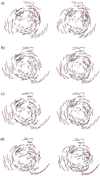
Figure 5
Stereo pairs for the motional patterns of the lowest-frequency deformational mode determined for 2CCY, by the standard NMA (a) by QEDM at 5 Å resolution (b) by QEDM at 7 Å resolution (c), and by QEDM at 15 Å resolution (d). The calculation was done with a cut-off distance of 13 Å. The thin gray lines are the trace of the Cα atoms and the red thicker lines represent the displacement vectors of the deformational mode. For illustrative purpose, the components of the displacement vectors on the centroids of Voronoi cells are translated to their nearest Cα atoms. The slight distortion of the trace of the Cα atom in a is the result of energy minimization, which is a weakness of the standard NMA.
Figure 6
The sensitivity of the frequencies of the lowest-frequency deformational modes with respect to the number of Voronoi cells (indicated at the upper-left corner). The calculations of QEDM were done with a 5-Å-resolution map of 2CCY. The protein contains 127 amino acids. The cut-off distance was 13 Å for the 127 cases and others were scaled by relation _R_cut ∝ N_−γ3 so as to keep the coordination number the same. Correspondingly, the values of the force constant γ in Eq. 5 were determined by fitting the B–factor curves against the experimental data. The harmonic frequencies were determined by relation ω ∝ (λ_N), here the factor accounting for the total mass of the protein is omitted so that the frequencies are in arbitrary unit. The frequencies are highly invariable in the cases that the numbers of Voronoi cells are larger than that of the amino acids, but significant deviation occurs for a smaller number (30 cells). Some discrepancy is also observed between the results of QEDM with 127 cells and ANM based on the Cα positions. The deviations of the frequencies in higher–frequency modes are much larger.
Similar articles
- Domain movements in human fatty acid synthase by quantized elastic deformational model.
Ming D, Kong Y, Wakil SJ, Brink J, Ma J. Ming D, et al. Proc Natl Acad Sci U S A. 2002 Jun 11;99(12):7895-9. doi: 10.1073/pnas.112222299. Proc Natl Acad Sci U S A. 2002. PMID: 12060737 Free PMC article. - Conformational flexibility of pyruvate dehydrogenase complexes: a computational analysis by quantized elastic deformational model.
Kong Y, Ming D, Wu Y, Stoops JK, Zhou ZH, Ma J. Kong Y, et al. J Mol Biol. 2003 Jun 27;330(1):129-35. doi: 10.1016/s0022-2836(03)00555-2. J Mol Biol. 2003. PMID: 12818207 - Study of protein dynamics by X-ray diffraction.
Ringe D, Petsko GA. Ringe D, et al. Methods Enzymol. 1986;131:389-433. doi: 10.1016/0076-6879(86)31050-4. Methods Enzymol. 1986. PMID: 3773767 - [A turning point in the knowledge of the structure-function-activity relations of elastin].
Alix AJ. Alix AJ. J Soc Biol. 2001;195(2):181-93. J Soc Biol. 2001. PMID: 11727705 Review. French. - On the relationship between low-frequency normal modes and the large-scale conformational changes of proteins.
Mahajan S, Sanejouand YH. Mahajan S, et al. Arch Biochem Biophys. 2015 Feb 1;567:59-65. doi: 10.1016/j.abb.2014.12.020. Epub 2015 Jan 3. Arch Biochem Biophys. 2015. PMID: 25562404 Review.
Cited by
- Survey of the analysis of continuous conformational variability of biological macromolecules by electron microscopy.
Sorzano COS, Jiménez A, Mota J, Vilas JL, Maluenda D, Martínez M, Ramírez-Aportela E, Majtner T, Segura J, Sánchez-García R, Rancel Y, Del Caño L, Conesa P, Melero R, Jonic S, Vargas J, Cazals F, Freyberg Z, Krieger J, Bahar I, Marabini R, Carazo JM. Sorzano COS, et al. Acta Crystallogr F Struct Biol Commun. 2019 Jan 1;75(Pt 1):19-32. doi: 10.1107/S2053230X18015108. Epub 2019 Jan 1. Acta Crystallogr F Struct Biol Commun. 2019. PMID: 30605122 Free PMC article. Review. - The ribosome structure controls and directs mRNA entry, translocation and exit dynamics.
Kurkcuoglu O, Doruker P, Sen TZ, Kloczkowski A, Jernigan RL. Kurkcuoglu O, et al. Phys Biol. 2008 Nov 24;5(4):046005. doi: 10.1088/1478-3975/5/4/046005. Phys Biol. 2008. PMID: 19029596 Free PMC article. - Shape-preserving elastic solid models of macromolecules.
Song G. Song G. PLoS Comput Biol. 2020 May 14;16(5):e1007855. doi: 10.1371/journal.pcbi.1007855. eCollection 2020 May. PLoS Comput Biol. 2020. PMID: 32407309 Free PMC article. - PIM: phase integrated method for normal mode analysis of biomolecules in a crystalline environment.
Lu M, Ma J. Lu M, et al. J Mol Biol. 2013 Mar 25;425(6):1082-98. doi: 10.1016/j.jmb.2012.12.026. Epub 2013 Jan 16. J Mol Biol. 2013. PMID: 23333742 Free PMC article. - Escherichia coli adenylate kinase dynamics: comparison of elastic network model modes with mode-coupling (15)N-NMR relaxation data.
Temiz NA, Meirovitch E, Bahar I. Temiz NA, et al. Proteins. 2004 Nov 15;57(3):468-80. doi: 10.1002/prot.20226. Proteins. 2004. PMID: 15382240 Free PMC article.
References
- Brooks C L, III, Karplus M, Pettitt B M. Adv Chem Phys. 1988;71:1–249.
- McCammon J A, Harvey S. Dynamics of Proteins and Nucleic Acids. Cambridge, U.K.: Cambridge University Press; 1987.
- Gerstein M, Lesk A M, Chothia C. Biochemistry. 1994;33:6739–6749. - PubMed
- Ma J, Sigler P B, Xu Z, Karplus M. J Mol Biol. 2000;302:303–313. - PubMed
Publication types
MeSH terms
Substances
LinkOut - more resources
Full Text Sources


