Mice lacking dopamine D2 and D3 receptors have spatial working memory deficits - PubMed (original) (raw)
Mice lacking dopamine D2 and D3 receptors have spatial working memory deficits
Sara B Glickstein et al. J Neurosci. 2002.
Abstract
Mice deficient for dopamine D(2) and D(3) receptors exhibit blunted c-fos responses to D(1) agonist stimulation. Stereologic cell counting revealed decreased numbers of medial prefrontal cortex neurons that express Fos immunoreactivity in all layers, particularly in the prelimbic and anterior cingulate subregions. Pretreatment of these mutants with a single, low dose of methamphetamine (METH) led to a sustained increase in the number of neurons that express Fos immunoreactivity in response to a D(1) agonist challenge, which was most significant in prelimbic and anterior cingulate subregions. The increased c-fos responses reached wild-type-like levels in METH-pretreated D(2) mutants but remained submaximal in METH-pretreated D(3) mutants. Additional studies tested the performance of wild type and mutants in a delayed alternation test, a cognitive task critically dependent on optimal activation of prefrontal cortical D(1) receptors by synaptically released dopamine. Both D(2) and D(3) mutants exhibited deficits in their spatial working memory, with increasing impairments at increasing delays. Whereas METH pretreatment rescued the spatial working memory of D(2) mutants, it had no effect on D(3) mutants. These data suggest that the sustained improvement of spatial working memory in METH-pretreated D(2) mutants is attributable to D(1) receptor-mediated mechanisms.
Figures
Fig. 1.
D1 agonist-stimulated forebrain c-fos mRNA expression. Northern blot of c-fos mRNA extracted from wild-type and D1, D2, and D3knock-out mice 60 min after injection of two full D1agonists SKF82958 (1 mg/kg) or SKF81297 (2 mg/kg). Each_lane_ contains 10 μg of total RNA extracted from tissues pooled from two animals per genotype. A, SKF82958-stimulated c-fos mRNA expression in wild-type (WT) and D1 −/− mice. The_lane_ marked D1* shows basal levels of c-fos mRNA detected in D1 mutants, and the_lane_ marked D1 shows c-_fos_mRNA detected in these mutants after SKF82958 injection. Note the absence of c-fos mRNA induction in SKF-treated D1 knock-out mice. B, Like SKF82958 (for a quantitative comparison, see Schmauss, 2000), the full D1 agonist SKF81297 also elicits blunted c-fos mRNA responses in D2 −/− (lanes marked D2) and D3−/− mice (lanes marked D3) that can be reversed by METH pretreatment (5 mg/kg). In this experiment, METH was administered 8 d before SKF81297 injection.
Fig. 2.
SKF82958-stimulated c-fos mRNA expression in drug-naive and METH-pretreated D2/D3 double mutants. In situ hybridization of c-fos mRNA expressed 60 min after SKF82958 (1 mg/kg) administration to drug-naive (saline-pretreated) wild type (WT) and drug-naive and METH-pretreated homozygous D2/D3double mutants (DM). METH (5 mg/kg) was administered 1 week before SKF administration. Sections were hybridized to a 35S-labeled antisense riboprobe comprising 540 nucleotides of the mouse c-fos mRNA. Images on film were digitized using the MCID image analysis system and colorized uniformly to highlight c-fos signal intensities. Note the blunted SKF-stimulated c-fos mRNA expression in drug-naive double mutants that is completely reversed by METH pretreatment.M, Motor cortices; Str, striatum. Scale bar, 1 mm.
Fig. 3.
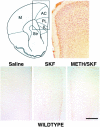
SKF82958-induced expression of Fos immunoreactivity in the PFC of wild type. Top, Schematic illustration of the regional extent of the mouse PFC in a cross section taken 5.5 mm rostral to the interaural line (Hof et al., 2000) and its cytoarchitecture visualized in a photomicrograph of an NeuN-immunolabeled section. Bottom, Expression of Fos immunoreactivity detected 60 min after saline or SKF82958 administration to wild type. In animals treated with saline, only a few nuclei express Fos immunoreactivity. SKF82958 induces a robust nuclear expression of Fos immunoreactivity in both the deep and superficial layers of the PFC. There is no obvious difference in the expression of SKF-stimulated Fos immunoreactivity between drug-naive and METH-pretreated wild type. M, Motor cortices; Str, striatum. Scale bar, 0.5 mm.
Fig. 4.
SKF82958-stimulated expression of Fos immunoreactivity in the prelimbic subregion of the PFC of D2 and D3 single mutants. Top, Detection of Fos immunoreactivity expressed 60 min after SKF82958 administration to drug-naive wild type (WT) and D2 (_D_2 −/−) and D3 (_D_3 −/−) mutants. Saline-treated mice of all genotypes expressed comparably low levels of Fos immunoreactivity (data not shown). In response to equivalent doses of SKF, drug-naive D2 and D3 mutants express blunted levels of Fos immunoreactivity throughout the prelimbic cortex.Bottom, Detection of Fos immunoreactivity (brown immunoperoxidase labeling) in neuronal nuclei (blue thionin counterstain) of the PFC of drug-naive wild-type and D2 and D3 mutants visualized at 100× magnification. Larger neurons were identified by nuclear size, and smaller neurons typically have only one or two thionin-labeled nuclear densities, a feature distinct from astrocytes. Scale bar, 0.25 mm.
Fig. 5.
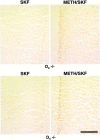
SKF82958-stimulated expression of Fos immunoreactivity in the prelimbic subregion of the PFC of drug-naive and METH-pretreated D2 and D3 single mutants. The blunted c-fos responses of drug-naive D2(D 2 −/−) and D3(_D_3 −/−) mutants are reversed when mutants were treated with METH (5 mg/kg) 1 week before an SKF82958 challenge. Scale bar, 0.25 mm.
Fig. 6.
Stereological comparison of the numbers of Fos-immunoreactive (Fos-ir) neurons in the PFC of wild type and D2 and D3 single mutants. Mean ± SEM percentages of neurons expressing SKF-induced Fos immunoreactivity (calculated as percentage of the total number of neurons) in the superficial (II/III) and deep (V/VI) layers of the IL, PL, and AC cortices of saline- or METH-pretreated mice. In D2 and D3 singlemutants, the numbers of neurons expressing Fos immunoreactivity are reduced in all subregions of the PFC compared with wild type (WT) (reductions rank, AC > PL > IL). c-fos responses to SKF82958 are increased by METH pretreatment of the mutants. This increase is larger in D2 mutants but remains submaximal (relative to wild type) in all three subregions of the PFC of D3mutants.
Fig. 7.
T-Maze performance of wild type and D2and D3 single mutants at four retention times. The mean ± SEM percentage of correct arm entries was determined from tests using eight animals per genotype. Each delay period was tested twice, and the means of both days were statistically compared (ANOVA) between wild type and mutants. A, Comparison of wild type (WT) and D3 −/− mutants trained in parallel. B, Comparison of second group of wild type trained in parallel with D2 −/− mutants. Delay periods (holding box retention times) are indicated on the_abscissa_. The dashed line across the_bars_ at 50% correct arm entries indicates chance performance.
Fig. 8.
Comparison of the T-maze performance of drug-naive and METH-pretreated wild type and D2 and D3mutants at three retention times. A, Comparison of drug-naive and METH-pretreated wild type tested in parallel with drug-naive and METH-pretreated D3 mutants.B, Comparison of drug-naive and METH-pretreated wild type tested in parallel with drug-naive and METH-pretreated D2 mutants. Delay periods are indicated on the_abscissa_, and the dashed line across the_bars_ at 50% correct arm entries indicates chance performance. Each delay period was tested twice, and the means of both days were statistically compared (ANOVA) between genotypes and treatment groups. Statistical differences are indicated on_top_ of the corresponding bars. In both series of experiments and for all three delay periods, no statistical differences were found between drug-naive and METH-pretreated wild type (wild type–D3 series, p = 0.09,p = 0.32, and p = 0.22 at 15, 20, and 30 sec delay, respectively; wild type–D2 series,p = 0.09, p = 0.10, and_p_ = 0.32 at 15, 20, and 30 sec delay, respectively).
Fig. 9.
SKF82958-stimulated c-fos mRNA expression detected 1–7 d after METH pretreatment. Northern blot of frontal cortical c-fos mRNA expressed 60 min after injection of SKF82958 (1 mg/kg) in drug-naive (lanes marked SKF) and METH-pretreated D2 (D2 −/−) and D3 (D3 −/−) mice. Lanes_marked 1, 3, 5, and_7 illustrate SKF-stimulated c-fos mRNA levels detected 1, 3, 5, and 7 d, respectively, after METH (5 mg/kg) pretreatment.
Similar articles
- A single dose of methamphetamine rescues the blunted dopamine D(1)-receptor activity in the neocortex of D(2)- and D(3)-receptor knockout mice.
Schmauss C, Glickstein SB, Adlersberg M, Hsiung SC, Tamir H. Schmauss C, et al. Ann N Y Acad Sci. 2002 Jun;965:21-7. doi: 10.1111/j.1749-6632.2002.tb04148.x. Ann N Y Acad Sci. 2002. PMID: 12105082 - Effect of methamphetamine on cognition and repetitive motor behavior of mice deficient for dopamine D2 and D3 receptors.
Glickstein SB, Schmauss C. Glickstein SB, et al. Ann N Y Acad Sci. 2004 Oct;1025:110-8. doi: 10.1196/annals.1316.014. Ann N Y Acad Sci. 2004. PMID: 15542707 - Mice lacking dopamine D2 and D3 receptors exhibit differential activation of prefrontal cortical neurons during tasks requiring attention.
Glickstein SB, Desteno DA, Hof PR, Schmauss C. Glickstein SB, et al. Cereb Cortex. 2005 Jul;15(7):1016-24. doi: 10.1093/cercor/bhh202. Epub 2004 Nov 10. Cereb Cortex. 2005. PMID: 15537671 - Focused motor stereotypies do not require enhanced activation of neurons in striosomes.
Glickstein SB, Schmauss C. Glickstein SB, et al. J Comp Neurol. 2004 Feb 2;469(2):227-38. doi: 10.1002/cne.11000. J Comp Neurol. 2004. PMID: 14694536
Cited by
- Regulation of ethanol intake under chronic mild stress: roles of dopamine receptors and transporters.
Delis F, Rombola C, Bellezza R, Rosko L, Grandy DK, Volkow ND, Thanos PK. Delis F, et al. Front Behav Neurosci. 2015 May 12;9:118. doi: 10.3389/fnbeh.2015.00118. eCollection 2015. Front Behav Neurosci. 2015. PMID: 26029066 Free PMC article. - Cognitive deficits triggered by early life stress: The role of histone deacetylase 1.
Adler SM, Schmauss C. Adler SM, et al. Neurobiol Dis. 2016 Oct;94:1-9. doi: 10.1016/j.nbd.2016.05.018. Epub 2016 May 31. Neurobiol Dis. 2016. PMID: 27260837 Free PMC article. - Focusing on symptoms rather than diagnoses in brain dysfunction: conscious and nonconscious expression in impulsiveness and decision-making.
Palomo T, Beninger RJ, Kostrzewa RM, Archer T. Palomo T, et al. Neurotox Res. 2008 Aug;14(1):1-20. doi: 10.1007/BF03033572. Neurotox Res. 2008. PMID: 18790722 - Cognition in mouse models of schizophrenia susceptibility genes.
Arguello PA, Gogos JA. Arguello PA, et al. Schizophr Bull. 2010 Mar;36(2):289-300. doi: 10.1093/schbul/sbp153. Epub 2009 Dec 21. Schizophr Bull. 2010. PMID: 20026558 Free PMC article. Review. - The effect of COMT Val158Met and DRD2 C957T polymorphisms on executive function and the impact of early life stress.
Klaus K, Butler K, Durrant SJ, Ali M, Inglehearn CF, Hodgson TL, Gutierrez H, Pennington K. Klaus K, et al. Brain Behav. 2017 Apr 12;7(5):e00695. doi: 10.1002/brb3.695. eCollection 2017 May. Brain Behav. 2017. PMID: 28523234 Free PMC article.
References
- Aultman JM, Moghaddam B. Distinct contributions of glutamate and dopamine receptors to temporal aspects of rodent working memory using a clinically relevant task. Psychopharmacology. 2001;153:353–364. - PubMed
- Baik J-H, Picetti R, Salardi A, Thiriet G, Dierich A, Depaulis A, Le Meur A, Borrelli E. Parkinsonian-like locomotor impairment in mice lacking dopamine D2 receptors. Nature. 1995;377:424–428. - PubMed
- Brozoski T, Brown RM, Rosvold HE, Goldman PS. Cognitive deficit caused by regional depletion of dopamine in prefrontal cortex of rhesus monkeys. Science. 1979;205:929–932. - PubMed
- Castner SA, Williams GV, Goldman-Rakic PS. Reversal of antipsychotic-induced working memory deficits by short-term dopamine D1 receptor stimulation. Science. 2000;287:2020–2022. - PubMed
Publication types
MeSH terms
Substances
LinkOut - more resources
Full Text Sources
Medical
Molecular Biology Databases
Miscellaneous


