Transcription factor complex formation and chromatin fine structure alterations at the murine c-fms (CSF-1 receptor) locus during maturation of myeloid precursor cells - PubMed (original) (raw)
Transcription factor complex formation and chromatin fine structure alterations at the murine c-fms (CSF-1 receptor) locus during maturation of myeloid precursor cells
Hiromi Tagoh et al. Genes Dev. 2002.
Abstract
Expression of the gene for the macrophage colony stimulating factor receptor (CSF-1R), c-fms, has been viewed as a hallmark of the commitment of multipotent precursor cells to macrophages. Lineage-restricted expression of the gene is controlled by conserved elements in the proximal promoter and within the first intron. To investigate the developmental regulation of c-fms at the level of chromatin structure, we developed an in vitro system to examine the maturation of multipotent myeloid precursor cells into mature macrophages. The dynamics of chromatin fine structure alterations and transcription factor occupancy at the c-fms promoter and intronic enhancer was examined by in vivo DMS and UV-footprinting. We show that the c-fms gene is already transcribed at low levels in early myeloid precursors on which no CSF-1R surface expression can be detected. At this stage of myelopoiesis, the formation of transcription factor complexes on the promoter was complete. By contrast, occupancy of the enhancer was acutely regulated during macrophage differentiation. Our data show that cell-intrinsic differentiation decisions at the c-fms locus precede the appearance of c-fms on the cell surface. They also suggest that complex lineage-specific enhancers such as the c-fms intronic enhancer regulate local chromatin structure through the coordinated assembly and disassembly of distinct transcription factor complexes.
Figures
Figure 1
Chromatin structure of mouse c-fms locus regulatory regions around the proximal promoter. (A) DNaseI hypersensitive sites (DHSs) represented as black arrows and restriction enzyme accessible sites (ovals) downstream of the _Pst_I site at +310 (relative to the ATG). Southern blot analysis was performed on _Pst_I-digested genomic DNA prepared from fibroblasts and macrophages that were treated with 50U and 100U of _Xba_I, _Hin_fI, _Pvu_II, _Ssp_I, and _Xmn_I. A _Pvu_II (+496)–_Bam_HI (+850) probe was used as indicated (hatched box). (B) Restriction enzyme accessible sites upstream of the _Bam_HI site (+849). One hundred units of restriction enzymes (_Hin_fI, _Ban_II, _Hin_dIII, and _Eco_RI) were used and _Bam_HI was used for complete digestion of genomic DNA for Southern blot analysis. The blot was probed with the _Pvu_II (+496) to _Bam_HI (+849) fragment (hatched box). Bands resulting from cleavage are indicated by open (weak accessibility) and closed (high accessibility) ovals. Black boxes show the second and third exons.
Figure 2
Precursor purification strategy. (A) Hematopoietic differentiation, from long-term stem cells to activated macrophage in adult mice, including marker gene expression as outlined in Akashi et al. (2000). Large, bold letters indicate high level expression. Small, plain letters indicate low level expression. (B) Experimental strategy for precursor purification and in vitro differentiation. The FACS profile shows the c-kit and ER-MP12 expression pattern on ER-MP20 negative cells. (C) Colony assay performed on sorted cells (c-kithigh/ER-MP12high or c-kithigh/ER-MP12−). Data are the average and the standard deviation of two independent experiments. (D) Colony morphology of CFU-GM and CFU-mix (upper panel) and May-Grünwald Giemsa staining of cells picked from CFU-mix colony (lower panel). Monocytes, neutrophils, erythroid cells, and mast cells can be seen.
Figure 3
Expression of cell surface antigen and morphological characterisation of purified and differentiated cells. Purified precursor cells and in vitro differentiated cells were analyzed at the indicated time points according to their size and granulation (A), expression of ER-MP12/ER-MP20 (B), c-kit (C), lineage markers (D), and M-CSF (CSF-1) receptor (E) on their surface by flow cytometry. (F) Morphology of differentiating cells as examined by May-Grünwald Giemsa staining of cytospins. Control antibody staining is indicated in E as non-gray profile.
Figure 4
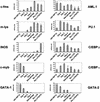
Marker gene and transcription factor gene expression. RT–PCR was performed on the total RNA prepared from purified precursor and differentiated cells as described in Materials and Methods. Arbitrary units were calculated after determining the fluorescent intensity of DNA stained with ethidium bromide using the Molecular Imager FX system. The bars represent the mean value of two independent amplifications normalized to GAPDH intensity.
Figure 5
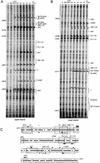
In vivo genomic footprinting of the c-fms promoter by LM–PCR and TD–PCR. (A) In vivo transcription factor occupancy of the mouse c-fms promoter region in purified precursor and in vitro differentiated cells by DMS footprinting. From left to right: DMS-treated naked DNA (G); embryonic fibroblast (EF); bone marrow cell fractions Lin−/c-kit+/ERMP12− (ckit+MP12−) and Lin−/c-kit+/ERMP12+ (d0); and in vitro differentiated cells (d2, d4, d7, d7+LPS). Primer set Prom01–03 was used to analyze upper strand of c-fms promoter region (Materials and Methods). Hyperreactive G(N7) contacts are indicated by closed circles on the right of each lane and protected Gs are indicated by open circles. The different transcription start sites are indicated by arrows on the left. The number on the right indicates the nucleotide position relative to the ATG, according to the published sequence. Protein binding sites are indicated on the right as a line. (B) Quantified and normalized band intensity of the DMS methylated Gs of the PU.1 binding site in the promoter. The LM-PCR products were labeled as described (Kontaraki et al. 2000) with IRD700 fluorescent dye-labeled primer and a LICOR DNA sequencer used to separate the fragments and provide quantitative, digitized data. To compensate the variation of sample loading, the band intensity on each lane was normalized by total lane intensity. Each bar shows the band intensity of Gs at the PU.1 binding site. (C) UV-photofootprinting analysis of the c-fms promoter. Naked DNA (DNA) or living cells (EF, ckit+MP12−, d0, d2, d3, d4, d7, d7+LPS) were irradiated with UV, and UV dimer formation was detected by TD–PCR (Kontaraki et al. 2000). The primer set used was the same as used for LM–PCR in A. (M) Size marker. Open circles on the right of each lane indicate diminished UV dimer formation compared with naked DNA. Gray circles mark chromatin fine structure changes specific for LPS treated macrophages (D) Summary of transcription factor binding sites occupied in vivo. Transcription factor binding sites and G(N7) contacts are indicated and transcription start sites are shown as arrows. The numbers are nucleotide position relative to the ATG.
Figure 6
In vivo transcription factor occupancy of FIRE in purified precursor and differentiated cells. DMS in vivo footprinting analyses for upper strand (A) and lower strand (B) of FIRE were performed on purified precursors and differentiated cells as described in Fig. 5A. Primer sets GB04–06 and GB01–03 were used to analyze upper and lower strands. For all other symbols see legend of Fig. 5. Only alterations in band intensity of at least twofold were considered to be significant as determined by the quantification of LM-PCR products run on a LICOR sequencer as depicted in Fig. 7. (C) Summary of the transcription factor assembly on the FIRE. Transcription factor binding sites are indicated as boxes, and thick bars between upper and lower strands represent the nucleotide positions that are conserved between mouse and human.
Figure 7
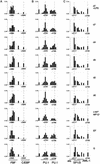
Developmental change of transcription factor assembly on the FIRE. To quantify the individual bands accurately, LM–PCR products were labeled with IRD700 and analyzed by use of a LICOR sequencer. Band intensities were quantified and normalized as described in Fig. 5B. (A) Guanine residues between +2849 and +2862 containing FBF and C/EBP binding sites (upper strand). (B) Guanine residues between nucleotide positions +2775 and +2791 including two PU.1 binding sites (lower strand). (C) Guanine residues between +2717 and +2730 (B) including a cluster of binding sites, ets, SP1/3, and AML-1 (lower strand).
Figure 8
Analysis of DNA–protein interactions in vitro. Protein binding assays were performed with nuclear extracts (NE) from MOP31C B cells (B) or bone marrow-derived macrophages (M). (A) Protein binding to the consensus Sp1 element in the FIRE enhancer. The Sp1 protein/DNA complex and supershifted complex with Sp1 specific antibody (Sp1SS) are marked. (B) Protein binding to a novel DNA element, within the FIRE enhancer, showing myeloid specificity (FBF1). Assays were performed with the nuclear extracts described in A. (Lower panel) Control for the different extracts using an oct consensus oligo. The upper, stronger band is generated by oct1, the lower band by oct2. (C) Protein binding assays were performed on one of the consensus AML-1 sites within the FIRE enhancer. Assays were performed with the nuclear extracts described in A. (D) Distinct protein–DNA complexes forming on the FIRE AML element (FAML) were compared to those forming on the previously characterized MMLV LTR binding site (VAML). Nuclear extracts from BMM were used in the assays (M). The ability of each element to cross-compete for protein binding was also assessed by addition of excess unlabeled oligonucleotide (comp.). The AML/CBF related protein binding is marked.
Similar articles
- c-FMS chromatin structure and expression in normal and leukaemic myelopoiesis.
Follows GA, Tagoh H, Richards SJ, Melnik S, Dickinson H, de Wynter E, Lefevre P, Morgan GJ, Bonifer C. Follows GA, et al. Oncogene. 2005 May 19;24(22):3643-51. doi: 10.1038/sj.onc.1208655. Oncogene. 2005. PMID: 15806141 - A highly conserved c-fms gene intronic element controls macrophage-specific and regulated expression.
Himes SR, Tagoh H, Goonetilleke N, Sasmono T, Oceandy D, Clark R, Bonifer C, Hume DA. Himes SR, et al. J Leukoc Biol. 2001 Nov;70(5):812-20. J Leukoc Biol. 2001. PMID: 11698502 - Transcriptional regulation of the c-fms proto-oncogene mediated by granulocyte/macrophage colony-stimulating factor (GM-CSF) in murine cell lines.
Helftenbein G, Krusekopf K, Just U, Cross M, Ostertag W, Niemann H, Tamura T. Helftenbein G, et al. Oncogene. 1996 Feb 15;12(4):931-5. Oncogene. 1996. PMID: 8632916 - Regulation of CSF-1 receptor expression.
Hume DA, Yue X, Ross IL, Favot P, Lichanska A, Ostrowski MC. Hume DA, et al. Mol Reprod Dev. 1997 Jan;46(1):46-52; discussion 52-3. doi: 10.1002/(SICI)1098-2795(199701)46:1<46::AID-MRD8>3.0.CO;2-R. Mol Reprod Dev. 1997. PMID: 8981363 Review. - Transcriptional regulation of c-fms gene expression.
Xie Y, Chen C, Hume DA. Xie Y, et al. Cell Biochem Biophys. 2001;34(1):1-16. doi: 10.1385/CBB:34:1:001. Cell Biochem Biophys. 2001. PMID: 11394438 Review. No abstract available.
Cited by
- The TAL1/SCL transcription factor regulates cell cycle progression and proliferation in differentiating murine bone marrow monocyte precursors.
Dey S, Curtis DJ, Jane SM, Brandt SJ. Dey S, et al. Mol Cell Biol. 2010 May;30(9):2181-92. doi: 10.1128/MCB.01441-09. Epub 2010 Mar 1. Mol Cell Biol. 2010. PMID: 20194619 Free PMC article. - Visualisation of chicken macrophages using transgenic reporter genes: insights into the development of the avian macrophage lineage.
Balic A, Garcia-Morales C, Vervelde L, Gilhooley H, Sherman A, Garceau V, Gutowska MW, Burt DW, Kaiser P, Hume DA, Sang HM. Balic A, et al. Development. 2014 Aug;141(16):3255-65. doi: 10.1242/dev.105593. Epub 2014 Jul 25. Development. 2014. PMID: 25063453 Free PMC article. - The evolution of the macrophage-specific enhancer (Fms intronic regulatory element) within the CSF1R locus of vertebrates.
Hume DA, Wollscheid-Lengeling E, Rojo R, Pridans C. Hume DA, et al. Sci Rep. 2017 Dec 7;7(1):17115. doi: 10.1038/s41598-017-15999-x. Sci Rep. 2017. PMID: 29215000 Free PMC article. - The function of the conserved regulatory element within the second intron of the mammalian Csf1r locus.
Sauter KA, Bouhlel MA, O'Neal J, Sester DP, Tagoh H, Ingram RM, Pridans C, Bonifer C, Hume DA. Sauter KA, et al. PLoS One. 2013;8(1):e54935. doi: 10.1371/journal.pone.0054935. Epub 2013 Jan 31. PLoS One. 2013. PMID: 23383005 Free PMC article. - Thyroid hormone-regulated enhancer blocking: cooperation of CTCF and thyroid hormone receptor.
Lutz M, Burke LJ, LeFevre P, Myers FA, Thorne AW, Crane-Robinson C, Bonifer C, Filippova GN, Lobanenkov V, Renkawitz R. Lutz M, et al. EMBO J. 2003 Apr 1;22(7):1579-87. doi: 10.1093/emboj/cdg147. EMBO J. 2003. PMID: 12660164 Free PMC article.
References
- Akashi K, Traver D, Miyamoto T, Weissman IL. A clonogenic common myeloid progenitor that gives rise to all myeloid lineages. Nature. 2000;404:193–197. - PubMed
- Alley EW, Murphy WJ, Russell SW. A classical enhancer element responsive to both lipopolysaccharide and interferon-gamma augments induction of the iNOS gene in mouse macrophages. Gene. 1995;158:247–251. - PubMed
- Bartelmez SH, Bradley TR, Bertoncello I, Mochizuki DY, Tushinski RJ, Stanley ER, Hapel AJ, Young IG, Kriegler AB, Hodgson GS. Interleukin 1 plus interleukin 3 plus colony-stimulating factor 1 are essential for clonal proliferation of primitive myeloid bone marrow cells. Exp Hematol. 1989;17:240–245. - PubMed
- Bossard P, Zaret KS. GATA transcription factors as potentiators of gut endoderm differentiation. Development. 1998;125:4909–4917. - PubMed
- Breen FN, Hume DA, Weidemann MJ. The effects of interleukin 3 (IL3) on cells responsive to macrophage colony-stimulating factor (CSF-1) in liquid bone marrow culture. Br J Haematol. 1990;74:138–147. - PubMed
Publication types
MeSH terms
Substances
LinkOut - more resources
Full Text Sources
Other Literature Sources
Medical
Research Materials
Miscellaneous


