Overlapping and unique roles for C-terminal binding protein 1 (CtBP1) and CtBP2 during mouse development - PubMed (original) (raw)
Overlapping and unique roles for C-terminal binding protein 1 (CtBP1) and CtBP2 during mouse development
Jeffrey D Hildebrand et al. Mol Cell Biol. 2002 Aug.
Abstract
The C-terminal binding protein (CtBP) family of proteins has been linked to multiple biological processes through their association with numerous transcription factors. We generated mice harboring mutations in both Ctbp1 and Ctbp2 to address the in vivo function of CtBPs during vertebrate development. Ctbp1 mutant mice are small but viable and fertile, whereas Ctbp2-null mice show defects in axial patterning and die by E10.5 due to aberrant extraembryonic development. Mice harboring various combinations of Ctbp1 and Ctbp2 mutant alleles exhibit dosage-sensitive defects in a wide range of developmental processes. The strong genetic interaction, as well as transcription assays with CtBP-deficient cells, indicates that CtBPs have overlapping roles in regulating gene expression. We suggest that the observed phenotypes reflect the large number of transcription factors whose activities are compromised in the absence of CtBP.
Figures
FIG. 1.
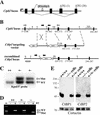
Disruption of mouse Ctbp1 and Ctbp2. (A) Schematic (not to scale) of the putative exon (black boxes) structure of the genomic locus, splicing pattern, and relative integration site of the βgeo∗bpA gene trap reporter relative to Ctbp2. (B) Schematic of the targeted mutation of Ctbp1 in ES cells. Grey arrowheads show the position of loxP sites, coding exons are depicted by black boxes, and the amino acids they encode are indicated below each exon; black arrowheads correspond to primers for PCR genotyping, and white arrowheads correspond to primers used for RT-PCR (D). (C) Southern blot of DNA from ES cells with a correctly targeted allele of Ctbp1. Genomic DNA from wild-type or targeted ES cells was subjected to Southern blotting following _Kpn_I digestion using the probe indicated in panel B (hatched box). (D) Targeting causes a deletion in Ctbp1 mRNA. RNA was isolated from the brains of wild-type (++), heterozygous (+-), and homozygous mutant (--) Ctbp1 mice and subjected to RT-PCR using primers specific to the 5′ UTR and exon immediately 3′ of the deletion. (E) Protein lysates derived from either wild-type E10.5 embryos, Ctbp1+/− Ctbp2+/− cells, or _Ctbp1_−/− _Ctbp2_−/− cells were assayed by Western blotting to detect CtBP1, CtBP2, and Ribeye. Membranes were reprobed with an antibody to the cytoskeletal protein cortactin as a loading control.
FIG. 2.
Expression of Ctbp1 and Ctbp2. (A to D) Heterozygous embryos were isolated at E7.5 (A), E9.5 (B), E10.5 (C), and E12.5 (D) of development and stained with X-Gal to detect expression of the βgeo∗bpA gene trap reporter (blue color). (E) Wild-type E10.5 embryos were subjected to RNA in situ hybridization using sense (right) and antisense (left) probes to the 3′ UTR of Ctbp1. ch, chorion; A, anterior; P, posterior; n, node; trg, trigeminal ganglion; ba, branchial arch; ov, otic vesicle; ht, heart; fl, forelimb bud; tel, telencephelon; nt, neural tube; drg, dorsal root ganglion.
FIG. 3.
Ctbp2 is an essential gene. (A and B) Embryos from mating Ctbp2+/− mice were isolated at E10.25 and visualized in whole mount. Lines in panel A indicate the approximate plan of the sections shown in panels D to G. At this stage, homozygous mutant (--) embryos exhibit a dilated pericardium (black arrowhead) and axial truncations (black arrow). (C) Brachyury (T) expression in _Ctbp2_−/− embryos. E9.5 (right) and E10.25 (left) embryos were isolated from timed mating of Ctbp2+/− animals and subjected to in situ hybridization in order to visualize T expression in the tail bud (white arrowheads). (D to G) H&E-stained sections of wild-type (D and F) and mutant (E and G) embryos. Embryos exhibit defects in heart morphogenesis (E) and degeneration of the neural epithelium (ne) (G). tr, trabeculae; a, atrium; v, ventricle; black arrowhead, pericardium.
FIG.4.
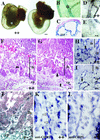
Ctbp2-null embryos exhibit defects in extraembryonic development. (A) Whole-mount view of Ctbp2 wild-type (++) and null (--) embryos in the yolk sac at E10.5. (B and C) To assess the expression of Ctbp2 in the yolk sac, yolk sacs from heterozygous embryos were isolated, stained with X-Gal, and visualized in whole mount (B) or after sectioning (C). X-Gal staining is detected in the blood vessels (asterisk) and the mesothelial layer (ms). (D and E) Yolk sacs from wild-type (D) and mutant (E) embryos were stained with anti-PECAM antibodies to detect the integrity of vascular endothelium. (F to I) Placental defects in _Ctbp2_-null embryos. Placentas from wild-type (F and H) and mutant (G and I) embryos were isolated at E9.5, fixed, sectioned, and subjected to either H&E staining (F and G) or immunohistochemistry to detect PECAM (H and I). Black arrowheads indicate chorioallantoic folding, and black arrows indicate vasculature. Abbreviations: cp, chorioallantoic plate; lb, labyrinthine layer. (J to L) Placental expression of CtBP1 and CtBP2. (J) The placenta from a Ctbp2 heterozygous E10.5 embryo was stained with X-Gal, sectioned, and counterstained. βgeo∗ activity is detected in the chorioallantoic plate, vascular cells of the labyrinthine layer, and some blood cells (white arrowheads). White arrows indicate expression in some of the presumptive vascular endothelial cells. (K and L) Sections from a wild-type E9.5 placenta were stained to detect CtBP2 (K) and CtBP1 (L). White arrows indicate CtBP2-positive vascular cells.
FIG. 5.
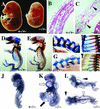
Genetic interaction between Ctbp1 and Ctbp2. (A to C) At E15.5, _Ctbp1_−/− Ctbp2+/− embryos exhibit a number of visible defects, including hemorrhaging, abnormal curvature, and reduced size (A). (B and C) Sections through the diaphragm of the embryos in panel A reveal defects in the formation of muscle (arrowheads). (D to I) Skeletal defects in _Ctbp1_−/− Ctbp2+/− embryos. E17.5 embryos were isolated and subjected to staining with Alcian blue and alizarin red to detect cartilage and ossified bone, respectively. Close-up views of the vertebral column (F and G) show defects in the formation of the vertebral bodies (brackets), arches, and lateral processes (white arrow) and an overall reduction in the amount of ossified bone (black arrowhead). Analysis of the ribs shows an overall defect in the staining of cartilage and ossified bone (H and I). (J to L) E9.25 embryos from Ctbp1+/− Ctbp2+/− crosses were isolated and photographed in whole mount. Reducing the dosage of Ctbp1 results in significant worsening of the _Ctbp2_−/− phenotype, such that Ctbp1+/− _Ctbp2_−/− embryos arrest at the time of turning and do not close the neural tube. (K and L) Embryos lacking both Ctbp1 and Ctbp2 exhibit multiple defects. In double mutant embryos, the heart has undergone minimal morphogenesis (white arrow), the allantois is occasionally bulbous (black arrow), there is blebbing of the neural ectoderm (black arrowheads), and the somites are irregular in both size and shape (white arrowhead). (L) Lateral (top) and dorsal (bottom) views of the same embryo.
FIG. 6.
Transcriptional defects in _Ctbp_-null cells. (A) Alignment of mouse and human Znf219. The putative CtBP binding site is underlined. (B) CtBP2 binds Znf219 in vitro. GST-Znf219 (5 μg) bound to glutathione-Sepharose was added to cell lysates (1 mg of total protein) derived from cells that express epitope tagged CtBP1 or CtBP2, pelleted, and the protein complexes resolved and analyzed by SDS-PAGE and Western blotting to detect epitope-tagged CtBP1 and CtBP2. (C) Schematic of the luciferase reporter and Gal4 DBD fusion proteins used in these experiments. (D) _Ctbp_-null (_Ctbp1_−/− _Ctbp2_−/−) cells display defects in transcriptional repression. CtBP-deficient cell lines (indicated along the bottom) were transfected with 4×Gal414DLuc, PGKβgalbpA, and the vectors expressing the indicated Gal4 DBD fusion proteins. Following transfection, cells were assayed for luciferase and β-galactosidase activity. Relative luciferase unit (RLU) measurement is the ratio of luciferase activity corrected for the amount of β-galactosidase activity, to control for transfection efficiency, with the value for the 4×Gal414DLuc vector alone set to 100.
Similar articles
- CtBP family proteins: more than transcriptional corepressors.
Chinnadurai G. Chinnadurai G. Bioessays. 2003 Jan;25(1):9-12. doi: 10.1002/bies.10212. Bioessays. 2003. PMID: 12508276 Review. - Expression of avian C-terminal binding proteins (Ctbp1 and Ctbp2) during embryonic development.
Van Hateren N, Shenton T, Borycki AG. Van Hateren N, et al. Dev Dyn. 2006 Feb;235(2):490-5. doi: 10.1002/dvdy.20612. Dev Dyn. 2006. PMID: 16258936 - Identification of CtBP1 and CtBP2 as corepressors of zinc finger-homeodomain factor deltaEF1.
Furusawa T, Moribe H, Kondoh H, Higashi Y. Furusawa T, et al. Mol Cell Biol. 1999 Dec;19(12):8581-90. doi: 10.1128/MCB.19.12.8581. Mol Cell Biol. 1999. PMID: 10567582 Free PMC article. - Expression of CtBP family protein isoforms in breast cancer and their role in chemoresistance.
Birts CN, Harding R, Soosaipillai G, Halder T, Azim-Araghi A, Darley M, Cutress RI, Bateman AC, Blaydes JP. Birts CN, et al. Biol Cell. 2010 Jan;103(1):1-19. doi: 10.1042/BC20100067. Biol Cell. 2010. PMID: 20964627 Free PMC article. - Transcriptional regulation by C-terminal binding proteins.
Chinnadurai G. Chinnadurai G. Int J Biochem Cell Biol. 2007;39(9):1593-607. doi: 10.1016/j.biocel.2007.01.025. Epub 2007 Feb 4. Int J Biochem Cell Biol. 2007. PMID: 17336131 Review.
Cited by
- Interaction of CtBP with adenovirus E1A suppresses immortalization of primary epithelial cells and enhances virus replication during productive infection.
Subramanian T, Zhao LJ, Chinnadurai G. Subramanian T, et al. Virology. 2013 Sep 1;443(2):313-20. doi: 10.1016/j.virol.2013.05.018. Epub 2013 Jun 5. Virology. 2013. PMID: 23747199 Free PMC article. - Golgi membrane dynamics and lipid metabolism.
Bankaitis VA, Garcia-Mata R, Mousley CJ. Bankaitis VA, et al. Curr Biol. 2012 May 22;22(10):R414-24. doi: 10.1016/j.cub.2012.03.004. Curr Biol. 2012. PMID: 22625862 Free PMC article. Review. - Role of the PLDLS-binding cleft region of CtBP1 in recruitment of core and auxiliary components of the corepressor complex.
Kuppuswamy M, Vijayalingam S, Zhao LJ, Zhou Y, Subramanian T, Ryerse J, Chinnadurai G. Kuppuswamy M, et al. Mol Cell Biol. 2008 Jan;28(1):269-81. doi: 10.1128/MCB.01077-07. Epub 2007 Oct 29. Mol Cell Biol. 2008. PMID: 17967884 Free PMC article. - CtBP-a targetable dependency for tumor-initiating cell activity and metastasis in pancreatic adenocarcinoma.
Chawla AT, Chougoni KK, Joshi PJ, Cororaton AD, Memari P, Stansfield JC, Park H, Seth R, Szomju B, Sima AP, Idowu MO, Ellis KC, Grossman SR. Chawla AT, et al. Oncogenesis. 2019 Oct 4;8(10):55. doi: 10.1038/s41389-019-0163-x. Oncogenesis. 2019. PMID: 31586042 Free PMC article. - Ligand-dependent corepressor LCoR is an attenuator of progesterone-regulated gene expression.
Palijan A, Fernandes I, Verway M, Kourelis M, Bastien Y, Tavera-Mendoza LE, Sacheli A, Bourdeau V, Mader S, White JH. Palijan A, et al. J Biol Chem. 2009 Oct 30;284(44):30275-87. doi: 10.1074/jbc.M109.051201. Epub 2009 Sep 10. J Biol Chem. 2009. PMID: 19744932 Free PMC article.
References
- Anson-Cartwright, L., K. Dawson, D. Holmyard, S. J. Fisher, R. A. Lazzarini, and J. C. Cross. 2000. The glial cells missing-1 protein is essential for branching morphogenesis in the chorioallantoic placenta. Nat. Genet. 25:311-314. - PubMed
- Brannon, M., J. D. Brown, R. Bates, D. Kimelman, and R. T. Moon. 1999. XCtBP is a XTcf-3 co-repressor with roles throughout Xenopus development. Development 126:3159-3170. - PubMed
- Deconinck, A. E., P. E. Mead, S. G. Tevosian, J. D. Crispino, S. G. Katz, L. I. Zon, and S. H. Orkin. 2000. FOG acts as a repressor of red blood cell development in Xenopus. Development 127:2031-2040. - PubMed
Publication types
MeSH terms
Substances
LinkOut - more resources
Full Text Sources
Molecular Biology Databases
Research Materials


