Acute myeloid leukemias with reciprocal rearrangements can be distinguished by specific gene expression profiles - PubMed (original) (raw)
Acute myeloid leukemias with reciprocal rearrangements can be distinguished by specific gene expression profiles
Claudia Schoch et al. Proc Natl Acad Sci U S A. 2002.
Abstract
Acute myeloid leukemia (AML) is a heterogeneous group of genetically defined diseases. Their classification is important with regard to prognosis and treatment. We performed microarray analyses for gene expression profiling on bone marrow samples of 37 patients with newly diagnosed AML. All cases had either of the distinct subtypes AML M2 with t(8;21), AML M3 or M3v with t(15;17), or AML M4eo with inv(16). Diagnosis was established by cytomorphology, cytogenetics, fluorescence in situ hybridization, and reverse transcriptase-PCR in every sample. By using two different strategies for microarray data analyses, this study revealed a unique correlation between AML-specific cytogenetic aberrations and gene expression profiles.
Figures
Figure 1
Three cytogenetically defined AML subtypes with t(15;17), t(8;21), or inv(16) can be separated based on their gene expression profiles of 1,000 preselected genes. The three different subgroups form distinct clusters. For visualization in a two-dimensional plot the first two principal components were chosen as they captured most of the variation in the original data set. The subgroups are colored according to their chromosomal aberrations.
Figure 2
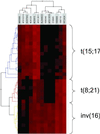
Hierarchical cluster analysis of the gene expression pattern of the set of 13 predictor genes as identified according to the adapted class prediction methodology introduced by Golub et al. (13). The three distinct cytogenetic AML subgroups can clearly be separated based on their gene expression profiles. Each row represents a leukemia sample and each column a gene. GenBank accession numbers are shown on the top. Varying expression levels are shown on a scale from black (no gene expression) to bright red (highest expression). The subgroups are colored according to their chromosomal aberrations.
Figure 3
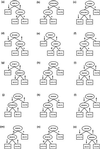
Schematic representation of the 15 decision trees (a_–_o) used in the multiple-tree classifier. Arrows indicate high (arrow up) or low (arrow down) expression, 0 and + denote absence or presence of a gene, respectively [e.g., in a the low expression of X96719 indicates AML with t(15;17) whereas the high expression of X96719 indicates AML with inv(16) or AML with t(8;21); the latter two entities are distinguished by X53742: lack of expression identifies AML with inv(16) and positive expression predicts AML with t(8;21)]. Accession numbers are given for relevant genes. Nodes are represented as ovals and leaves as rectangles. Classes are referred to as t(15;17), t(8;21), or inv(16).
Similar articles
- Cytogenetic profile in de novo acute myeloid leukemia with FAB subtypes M0, M1, and M2: a study based on 652 cases analyzed with morphology, cytogenetics, and fluorescence in situ hybridization.
Klaus M, Haferlach T, Schnittger S, Kern W, Hiddemann W, Schoch C. Klaus M, et al. Cancer Genet Cytogenet. 2004 Nov;155(1):47-56. doi: 10.1016/j.cancergencyto.2004.03.008. Cancer Genet Cytogenet. 2004. PMID: 15527902 - Molecular characterization of acute leukemias by use of microarray technology.
Kohlmann A, Schoch C, Schnittger S, Dugas M, Hiddemann W, Kern W, Haferlach T. Kohlmann A, et al. Genes Chromosomes Cancer. 2003 Aug;37(4):396-405. doi: 10.1002/gcc.10225. Genes Chromosomes Cancer. 2003. PMID: 12800151 - Genome-wide analysis of acute myeloid leukemia with normal karyotype reveals a unique pattern of homeobox gene expression distinct from those with translocation-mediated fusion events.
Debernardi S, Lillington DM, Chaplin T, Tomlinson S, Amess J, Rohatiner A, Lister TA, Young BD. Debernardi S, et al. Genes Chromosomes Cancer. 2003 Jun;37(2):149-58. doi: 10.1002/gcc.10198. Genes Chromosomes Cancer. 2003. PMID: 12696063 - Gene expression profiling in acute myeloid leukemia.
Bullinger L, Valk PJ. Bullinger L, et al. J Clin Oncol. 2005 Sep 10;23(26):6296-305. doi: 10.1200/JCO.2005.05.020. J Clin Oncol. 2005. PMID: 16155012 Review. - Gene expression with prognostic implications in cytogenetically normal acute myeloid leukemia.
Baldus CD, Bullinger L. Baldus CD, et al. Semin Oncol. 2008 Aug;35(4):356-64. doi: 10.1053/j.seminoncol.2008.04.006. Semin Oncol. 2008. PMID: 18692686 Review.
Cited by
- Cross-platform analysis of cancer microarray data improves gene expression based classification of phenotypes.
Warnat P, Eils R, Brors B. Warnat P, et al. BMC Bioinformatics. 2005 Nov 4;6:265. doi: 10.1186/1471-2105-6-265. BMC Bioinformatics. 2005. PMID: 16271137 Free PMC article. - Differential Analysis of Genetic, Epigenetic, and Cytogenetic Abnormalities in AML.
Islam M, Mohamed Z, Assenov Y. Islam M, et al. Int J Genomics. 2017;2017:2913648. doi: 10.1155/2017/2913648. Epub 2017 Jun 20. Int J Genomics. 2017. PMID: 28713819 Free PMC article. - Not Only Mutations Matter: Molecular Picture of Acute Myeloid Leukemia Emerging from Transcriptome Studies.
Handschuh L. Handschuh L. J Oncol. 2019 Jul 30;2019:7239206. doi: 10.1155/2019/7239206. eCollection 2019. J Oncol. 2019. PMID: 31467542 Free PMC article. Review. - New data on robustness of gene expression signatures in leukemia: comparison of three distinct total RNA preparation procedures.
Campo Dell'Orto M, Zangrando A, Trentin L, Li R, Liu WM, te Kronnie G, Basso G, Kohlmann A. Campo Dell'Orto M, et al. BMC Genomics. 2007 Jun 22;8:188. doi: 10.1186/1471-2164-8-188. BMC Genomics. 2007. PMID: 17587440 Free PMC article. - Stratification of acute myeloid leukemia based on gene expression profiles.
Mano H. Mano H. Int J Hematol. 2004 Dec;80(5):389-94. doi: 10.1532/ijh97.04111. Int J Hematol. 2004. PMID: 15646648 Review.
References
- Bennett J M, Catovsky D, Daniel M T, Flandrin G, Galton D A, Gralnick H R, Sultan C. Br J Haematol. 1976;33:451–458. - PubMed
- Harris N L, Jaffe E S, Diebold J, Flandrin G, Muller Hermelink H K, Vardiman J, Lister T A, Bloomfield C D. J Clin Oncol. 1999;17:3835–3849. - PubMed
- Jaffe E S, Harris N L, Stein H, Vardiman J W. World Health Organization Classification of Tumors: Pathology and Genetics of Tumors of Hematopoietic and Lymphoid Tissues. Lyon: IARC Press; 2001.
- Grimwade D, Walker H, Oliver F, Wheatley K, Harrison C, Harrison G, Rees J, Hann I, Stevens R, Burnett A, et al. Blood. 1998;92:2322–2333. - PubMed
- Bloomfield C D, Shuma C, Regal L, Philip P P, Hossfeld D K, Hagemeijer A M, Garson O M, Peterson B A, Sakurai M, Alimena G, et al. Cancer. 1997;80:2191–2198. - PubMed
Publication types
MeSH terms
LinkOut - more resources
Full Text Sources
Other Literature Sources
Medical


